Petrol vs Diesel in 2026: Which Is Cheaper to Run?

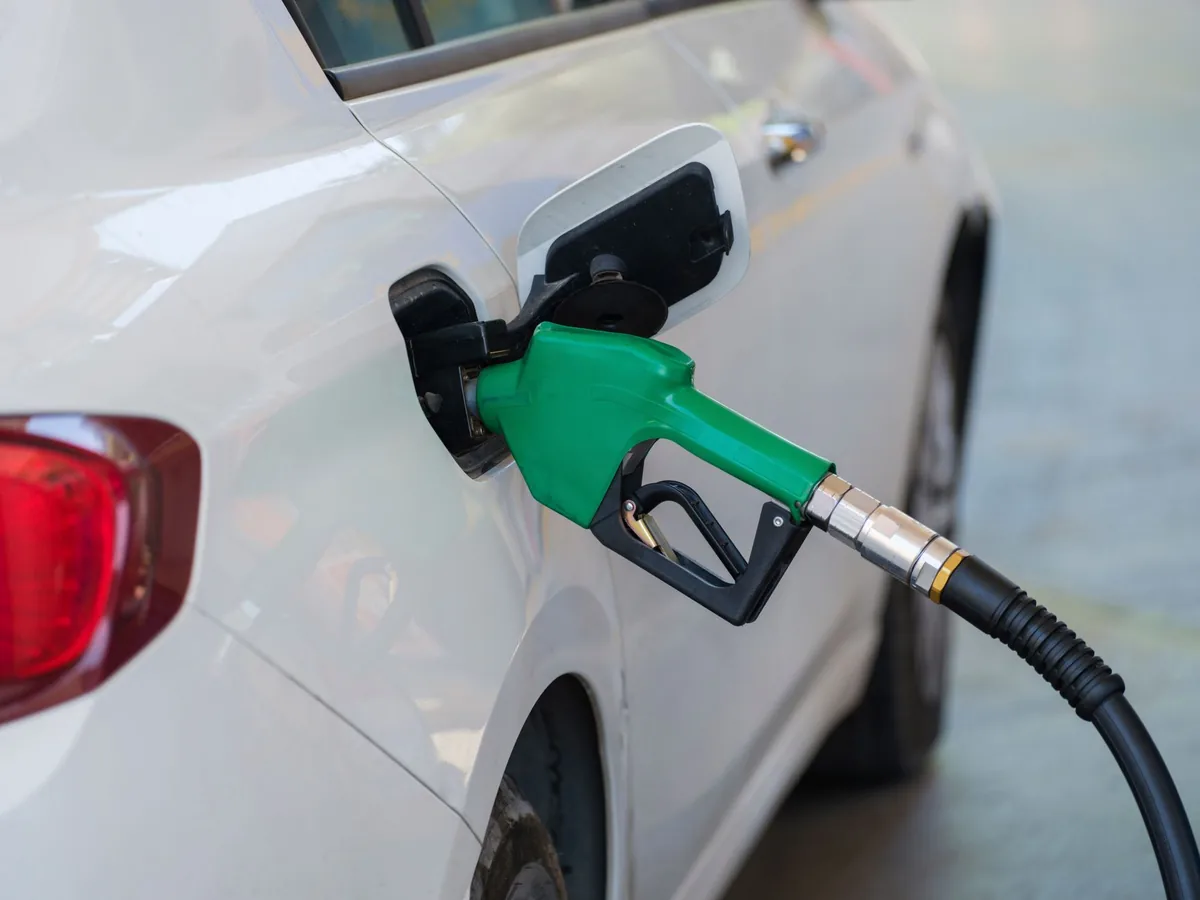
Petrol vs diesel in 2026 is no longer the easy call it was a decade ago. UK diesel costs £1.86 a litre against £1.64 for petrol — a 13.4% pump premium — and our analysis of 7,230 official UK Vehicle Certification Agency records shows diesel still wins on fuel cost for most cars, but by a margin far narrower than drivers expect.
We paired every model-year that appears in the VCA database with both fuels, costed each at 12,000 miles a year, and worked out exactly how much more efficient a diesel must be to justify the extra £0.22 per litre. The full leaderboards, head-to-head tables and break-even maths follow.
How this petrol vs diesel comparison was built
Every figure here comes from the UK Vehicle Certification Agency database, the official source for type-approval fuel consumption and CO₂ data. Filtering to records carrying a metric litres-per-100 km figure gave 7,230 rows: 4,103 petrol and 3,127 diesel, spanning model years from the early 2000s to 2026.
One consistent set of verified UK constants is applied to every row: petrol £1.64 per litre, diesel £1.86 per litre (EU Oil Bulletin, week of 31 August 2026), 12,000 miles a year, and 1 mile = 1.609344 km. Annual fuel is litres per 100 km × 1.609344 ÷ 100 × 12,000 × pump price, which is 19,312 km of driving. Because the constants never change, the tables are a pure efficiency index — halve the figures for 6,000 miles, double them for 24,000.
Prices are national pump averages for the week of 31 August 2026. Individual forecourts vary, sometimes by several pence a litre.
The 2026 petrol vs diesel price gap: 13.4% against diesel
The ratio between the two pump prices drives the entire question. In the UK in 2026 diesel costs 13.4% more per litre than petrol — 1.1341 on the price ratio — so a diesel must beat its petrol equivalent on consumption by more than 13.4% just to draw level.
A 50-litre fill makes the premium tangible: about £82 of petrol against about £93 of diesel, an £11 penalty every visit. For international context, the EU Oil Bulletin puts the same week's EU average at €1.840 per litre for petrol and €1.966 for diesel, a gap of roughly 7%. The UK's diesel premium is close to double the EU norm, which is why diesel looks weaker here than almost anywhere in Europe.
- UK petrol £1.64/L, diesel £1.86/L — a 13.4% diesel premium (EU Oil Bulletin, 31 Aug 2026)
- EU average petrol €1.840/L, diesel €1.966/L — roughly a 7% diesel premium
- A 50-litre tankful: about £82 of petrol versus about £93 of diesel
The break-even rule: a diesel must beat petrol by 11.8%
Turn the price ratio into a test. Because diesel costs 13.4% more per litre, a diesel car has to burn at least 11.8% less fuel per 100 km than the petrol car it replaces. The arithmetic is simply: take the petrol figure and multiply by 0.8817.
A petrol car at 6.0 L/100km therefore needs a diesel below 5.29 L/100km. A petrol car at 4.0 L/100km — already frugal — needs a diesel below 3.53 L/100km, which is the very edge of what production cars achieve. That is why diesel's advantage vanishes among small efficient petrol cars and becomes reliable only once the petrol alternative is thirsty.
| Petrol consumption | Diesel must be below | Efficiency needed |
|---|---|---|
| 3.5 L/100km | 3.09 L/100km | 11.8% |
| 4.0 L/100km | 3.53 L/100km | 11.8% |
| 5.0 L/100km | 4.41 L/100km | 11.8% |
| 6.0 L/100km | 5.29 L/100km | 11.8% |
| 7.0 L/100km | 6.17 L/100km | 11.8% |
| 8.0 L/100km | 7.05 L/100km | 11.8% |
| 9.0 L/100km | 7.94 L/100km | 11.8% |
Cheapest petrol cars in the UK: the efficiency leaderboard
The most frugal petrol car in the UK dataset is the Suzuki Celerio at 3.6 L/100km, £1,140 a year. A cluster of city cars and superminis follows at 3.8 L/100km and £1,204: Citroën C1, Fiat 500 and 500C, Kia Niro and Peugeot 108. At 4.0 L/100km the Hyundai i10, Peugeot 308, Smart fortwo coupé and older Fiat 500 cost £1,267.
The top of this table is remarkably tight — the difference between the best and twelfth-best petrol car in Britain is £159 a year, about £3 a week. That matters for the diesel argument: the cheapest petrol cars already sit at 3.6–4.1 L/100km, so only a handful of diesels in the entire database can beat them.
| Make | Model | Year | Consumption | CO₂ | Annual fuel |
|---|---|---|---|---|---|
| Suzuki | Celerio | 2016 | 3.6 L/100km | 84 g/km | £1,140 |
| Citroën | C1 | 2016 | 3.8 L/100km | 88 g/km | £1,204 |
| Citroën | New C1 | 2014 | 3.8 L/100km | 88 g/km | £1,204 |
| Fiat | 500 & 500C | 2016 | 3.8 L/100km | 90 g/km | £1,204 |
| Kia | Niro | 2017 | 3.8 L/100km | 88 g/km | £1,204 |
| Peugeot | 108 | 2014 | 3.8 L/100km | 88 g/km | £1,204 |
| Fiat | 500 and 500C | 2011 | 4.0 L/100km | 92 g/km | £1,267 |
| Hyundai | i10 | 2017 | 4.0 L/100km | 93 g/km | £1,267 |
| Peugeot | 308 | 2016 | 4.0 L/100km | 95 g/km | £1,267 |
| Smart | fortwo coupé | 2016 | 4.0 L/100km | 98 g/km | £1,267 |
| Chrysler | Ypsilon | 2012 | 4.1 L/100km | 97 g/km | £1,299 |
| Fiat | New Panda | 2012 | 4.1 L/100km | 95 g/km | £1,299 |
Cheapest diesel cars in the UK: the leaderboard narrows fast
The most efficient diesel in the UK dataset is the Peugeot 208 at 3.0 L/100km and £1,078 a year — the lowest fuel bill of any combustion car we hold. Behind it, a large group ties at 3.2 L/100km and £1,149: Ford Fiesta, Citroën C4 Cactus, Hyundai i20, Kia Rio in all bodystyles and Nissan Micra. The Peugeot 308 sits at 3.1 L/100km and £1,114.
Compare the two leaderboards and the headline is uncomfortable for diesel. The best diesel in Britain costs £1,078 a year; the best petrol costs £1,140. The entire advantage is £62 — about £1.19 a week — and that is winner against winner, not a like-for-like car. At the 3.0–4.0 L/100km end of the market both fuels are near the test cycle's floor, so the 13.4% pump premium eats almost the whole efficiency gain.
Both leaderboards are dominated by the same segment — B-segment hatchbacks and city cars. On fuel cost alone, the gap between the best petrol and the best diesel in the UK is £62 a year.
Head to head: 2,148 model-years available with both fuels
Leaderboards compare different cars. The real test is the same car with two engines. We found 2,148 make-model-year combinations in the VCA database with both a petrol and a diesel record, and used the most efficient variant of each.
Diesel wins at 12,000 miles in 2,064 of the 2,148 pairs — 96%. The median diesel beats its petrol counterpart by 25.7% on consumption (4.50 against 6.10 L/100km), comfortably clearing the 11.8% bar. The 84 losing pairs are the instructive ones: four post identical official figures for both fuels, so the diesel loses purely to the £0.22 pump premium, and the rest are simply not efficient enough to cover it.
| Make | Model | Year | Petrol L/100km | Diesel L/100km | Petrol/yr | Diesel/yr | Diesel saves |
|---|---|---|---|---|---|---|---|
| Vauxhall | Insignia Sport Tourer | 2014 | 10.9 | 3.9 | £3,452 | £1,401 | £2,051 |
| Mercedes-Benz | S-Class Saloon | 2022 | 13.5 | 6.4 | £4,276 | £2,299 | £1,977 |
| Volvo | XC60 | 2014 | 10.9 | 4.5 | £3,452 | £1,616 | £1,836 |
| Vauxhall | Insignia Sport Tourer | 2013 | 10.9 | 4.5 | £3,452 | £1,616 | £1,836 |
| Jeep | Grand Cherokee | 2013 | 14.1 | 7.4 | £4,466 | £2,658 | £1,808 |
| Jeep | Grand Cherokee | 2019 | 16.6 | 9.7 | £5,258 | £3,484 | £1,773 |
| Infiniti | Q70 | 2017 | 10.9 | 4.8 | £3,452 | £1,724 | £1,728 |
| Volvo | XC70 | 2014 | 10.5 | 4.5 | £3,326 | £1,616 | £1,709 |
| Jaguar | XF | 2011 | 11.3 | 5.4 | £3,579 | £1,940 | £1,639 |
| Land Rover | Range Rover | 2013 | 13.5 | 7.4 | £4,276 | £2,658 | £1,618 |
The 84 model-years where diesel costs more to run
A 96% win rate still leaves 84 model-years where the diesel costs more at 12,000 miles. They cluster in two places: heavy cars whose petrol engines are equally efficient, and small cars where both fuels are already near the floor of the test cycle.
The worst case is the 2021 Nissan X-Trail, where both fuels post 7.2 L/100km, so diesel simply costs £306 more a year. The 2014 Mercedes-Benz E-Class Estate, 2012 Volvo XC60 and 2012 Volvo XC70 all post matching figures and lose £234–£259. The Fiat 500 is the clearest small-car example: 4.0 L/100km petrol against 3.9 diesel, a 3% gain that is nowhere near the 11.8% needed, costing £134 a year more in fuel.
| Make | Model | Year | Petrol L/100km | Diesel L/100km | Diesel costs more/yr | Gain |
|---|---|---|---|---|---|---|
| Nissan | X-Trail | 2021 | 7.2 | 7.2 | £306 | 0% |
| Mercedes-Benz | E-Class Estate | 2014 | 6.1 | 6.1 | £259 | 0% |
| Volvo | XC60 | 2012 | 5.6 | 5.6 | £238 | 0% |
| Volvo | XC70 | 2012 | 5.5 | 5.5 | £234 | 0% |
| Nissan | X-Trail | 2026 | 7.7 | 7.3 | £183 | 5% |
| Mercedes-Benz | E-Class Saloon | 2014 | 5.9 | 5.6 | £143 | 5% |
| Fiat | 500 and 500C | 2012 | 4.0 | 3.9 | £134 | 3% |
| Fiat | 500 and 500C | 2011 | 4.0 | 3.9 | £134 | 3% |
| Škoda | Karoq | 2026 | 6.2 | 5.8 | £120 | 6% |
| SEAT | Ateca | 2016 | 5.2 | 4.9 | £113 | 6% |
| Hyundai | i20 | 2017 | 4.3 | 4.1 | £111 | 5% |
| Mitsubishi | ASX | 2012 | 5.9 | 5.5 | £107 | 7% |
Named model showdowns: the same car with two engines
Percentages become decisions when attached to cars people buy. We pulled the latest model-year for eight familiar UK names where both fuels exist in the official data.
The split is clean. The Peugeot 208 (2019) shows the classic case — 6.3 L/100km petrol against 4.2 diesel, a 33% gain saving £487 a year. The Volvo XC60 (2019) saves £486, the Nissan Qashqai (2018) £314, the Kia Sportage (2022) £254, the Ford Focus (2022) £242 and the Ford Fiesta (2017) £212. Then there is the Volkswagen Golf: 4.8 L/100km petrol against 4.2 diesel, a 12% gain that only just clears the threshold, for a saving of £12 a year — 92p a month.
| Model (year) | Petrol L/100km | Petrol/yr | Diesel L/100km | Diesel/yr | Diesel saves | Gain |
|---|---|---|---|---|---|---|
| Peugeot 208 (2019) | 6.3 | £1,995 | 4.2 | £1,509 | £487 | 33% |
| Volvo XC60 (2019) | 9.7 | £3,072 | 7.2 | £2,586 | £486 | 26% |
| Nissan Qashqai (2018) | 5.3 | £1,679 | 3.8 | £1,365 | £314 | 28% |
| Kia Sportage (2022) | 6.7 | £2,122 | 5.2 | £1,868 | £254 | 22% |
| Ford Focus (2022) | 5.3 | £1,679 | 4.0 | £1,437 | £242 | 25% |
| Ford Fiesta (2017) | 4.3 | £1,362 | 3.2 | £1,149 | £212 | 26% |
| Toyota Yaris (2018) | 4.3 | £1,362 | 3.5 | £1,257 | £105 | 19% |
| Volkswagen Golf (2018) | 4.8 | £1,520 | 4.2 | £1,509 | £12 | 12% |
Average and median fuel costs by fuel type
Across all 7,230 UK VCA records the petrol average is 7.62 L/100km and the diesel average 5.11 L/100km. At 12,000 miles that is £2,414 for the average petrol car and £1,834 for the average diesel — a £580 annual gap.
Medians tell a less flattering story, because the dataset holds more large petrol SUVs and performance cars than large diesels, which drags the petrol mean upwards. The median petrol car uses 6.6 L/100km (£2,090) and the median diesel 4.8 L/100km (£1,724): a £366 gap, 27% smaller than the mean-based figure. The median is the more honest number for a typical buyer.
How the diesel saving scales with your annual mileage
Fuel savings are linear in mileage, so break-even is always a mileage question. Take the median diesel-cheaper pair — 6.10 L/100km petrol against 4.50 diesel. Petrol costs 16.10p a mile in fuel, diesel 13.47p, a saving of 2.63p per mile.
That 2.63p is the entire diesel case at UK 2026 prices. At 6,000 miles it is worth £158; at 12,000 miles £316; at 20,000 miles £526; at 30,000 miles £789. Nothing except mileage changes the per-mile figure. A driver at 6,000 miles is unlikely ever to recover a four-figure diesel premium; a driver at 25,000 miles recovers the same premium in under two years.
| Annual miles | Petrol fuel | Diesel fuel | Diesel saves |
|---|---|---|---|
| 6,000 | £966 | £808 | £158 |
| 8,000 | £1,288 | £1,078 | £210 |
| 10,000 | £1,610 | £1,347 | £263 |
| 12,000 | £1,932 | £1,616 | £316 |
| 15,000 | £2,415 | £2,021 | £394 |
| 20,000 | £3,220 | £2,694 | £526 |
| 25,000 | £4,025 | £3,368 | £657 |
| 30,000 | £4,830 | £4,041 | £789 |
Break-even mileage for a diesel purchase premium
Fuel cost is only half the diesel equation. A diesel variant usually costs more to buy, and that premium has to be recovered from the 2.63p per mile saving: divide the premium by the per-mile saving to get the mileage at which diesel starts paying you back.
A £500 premium is recovered after roughly 19,000 miles — 1.6 years at 12,000 miles a year. A £1,000 premium takes about 38,000 miles, or 3.2 years. A £2,000 premium takes about 76,000 miles, or 6.3 years, by which point many owners have sold the car and never seen a net gain. Two cautions: the premiums below are illustrative inputs showing how the formula behaves, because our database holds consumption data rather than UK list prices; and the calculation is fuel-only, ignoring diesel's historically higher servicing costs and weaker resale in expanding clean-air zones. Both push the true break-even mileage higher.
| Diesel price premium (illustrative) | Miles to recover | Years at 12,000 miles/yr |
|---|---|---|
| £500 | 19,014 | 1.6 |
| £750 | 28,521 | 2.4 |
| £1,000 | 38,028 | 3.2 |
| £1,500 | 57,041 | 4.8 |
| £2,000 | 76,055 | 6.3 |
| £2,500 | 95,069 | 7.9 |
Per-mile figures: petrol 16.10p, diesel 13.47p, saving 2.63p per mile. Fuel only — servicing and resale are excluded.
Why the diesel advantage grows with vehicle size
Group the 2,148 paired model-years by the petrol car's consumption and a clear pattern emerges. In the heaviest band — petrol cars at 8.0 L/100km or more — all 412 pairs favour diesel, with a median efficiency gain of 32.8%. The gain falls steadily as cars get smaller: 27.8% in the 7.0–7.9 band, 26.2% at 6.0–6.9, 25.0% at 5.0–5.9 and 20.9% at 4.0–4.9.
In the smallest band, petrol under 4.0 L/100km, the median diesel gain is just 10.5% — below the 11.8% break-even, so diesel loses on fuel in all three pairs available. The reason is mechanical: a diesel's thermal-efficiency advantage is largest under load. Big cars work a small petrol engine hard everywhere, while a light city car barely loads either engine, so the cheaper fuel wins. For SUVs, large estates and towing, diesel has the data on its side. For superminis, it does not.
| Petrol band | Pairs | Median diesel gain | Diesel-cheaper pairs |
|---|---|---|---|
| Under 4.0 L/100km | 3 | 10.5% | 0 of 3 |
| 4.0–4.9 L/100km | 263 | 20.9% | 226 of 263 |
| 5.0–5.9 L/100km | 667 | 25.0% | 651 of 667 |
| 6.0–6.9 L/100km | 555 | 26.2% | 536 of 555 |
| 7.0–7.9 L/100km | 248 | 27.8% | 239 of 248 |
| 8.0 L/100km and over | 412 | 32.8% | 412 of 412 |
The high-mileage motorway case where diesel still wins clearly
The largest diesel win in the dataset belongs to the 2014 Vauxhall Insignia Sports Tourer: 10.9 L/100km petrol against 3.9 diesel, a 64% difference worth £2,051 a year. The 2022 Mercedes-Benz S-Class Saloon saves £1,977 and the 2013 Jeep Grand Cherokee £1,808. All are heavy cars whose petrol variants are genuinely thirsty.
Treat the largest percentages as an upper bound rather than a forecast, since a 64% gap between two versions of one car reflects a petrol variant tested on a different cycle from the diesel. The direction is solid: heavy car, strong diesel, large saving. For the driver covering 25,000 motorway miles a year in a large estate or SUV, diesel still makes complete sense — at the median 2.63p per mile that is £657 a year, and the gap on a big car is wider than the median.

Short trips, DPF regeneration and the hidden diesel cost
Diesel particulate filters need sustained exhaust temperatures to burn off accumulated soot. Short urban journeys — school runs, sub-15-minute commutes, repeated cold starts — never reach them, so the filter clogs and eventually demands a forced regeneration or replacement. None of that appears in a litres-per-100 km table.
This is where the diesel case breaks in practice. The official gap says a diesel at £1,365 a year beats a petrol at £1,679 by £314, but a blocked filter, a failed EGR valve or a set of injectors can exceed the annual saving in a single workshop visit. Petrol and mild-hybrid cars tolerate stop-start use far better, recovering energy on deceleration and switching off at a standstill — exactly where a diesel is at its worst.
The comparison in this guide is fuel cost only. It takes no account of diesel servicing, DPF or AdBlue costs, insurance group differences or resale values.
CO₂, VED and the tax side of petrol vs diesel
Diesel's CO₂ performance in our dataset is genuinely better: a mean of 134 g/km against 176 g/km for petrol, and a median of 125 g/km against 152 g/km. That follows directly from lower fuel consumption, since CO₂ output tracks the carbon actually burned.
In the UK, VED for cars registered since April 2017 is a flat annual rate plus a first-year charge based on CO₂, and it does not favour diesel specifically. As reference points only, the 111–130 g/km band sits at roughly £190 a year and the MOT fee is capped at £54.85; both are excluded from every fuel total here. Diesel no longer receives the structural tax advantage it once had, so the 11.8% efficiency test is what decides the purchase.
Data quality: the one record we excluded
No ranking is published without a source-data check. Applying a 2.5–25.0 L/100km plausibility window to the UK dataset returned exactly one row outside it: a 2022 Mazda CX-60 petrol listed at 141.2 L/100km with 180 g/km CO₂. At 141.2 L/100km the car would return roughly 3.4 miles per gallon, and the paired CO₂ value is inconsistent with it, so this is a data-entry artefact. It is excluded from every average, median, pair and leaderboard here.
That single exclusion is a useful signal: 7,230 records across two decades passed cleanly, which is why no mass filtering was needed. One labelling caveat applies — the VCA database uses manufacturer wording such as 'Model Year Post 2017' or '2012 Facelift' in some model strings. We normalised those labels when pairing petrol and diesel versions of the same car; the consumption figures themselves are untouched official values.
Excluded: 2022 Mazda CX-60 petrol, 141.2 L/100km, 180 g/km CO₂ (source artefact). No other UK record fell outside the 2.5–25.0 L/100km window.
What these fuel figures leave out
Every table here is an energy cost — what moving the car costs in fuel at 12,000 miles a year, and nothing else. The omissions matter, because they are where the real-world decision often flips.
Depreciation is normally the largest single ownership cost: a typical new car loses roughly 15–25% of its value in year one and about 50% over five years. Diesel resale has weakened as low-emission zones tighten and UK clean air zones expand, so a diesel bought today carries more resale risk than a petrol or hybrid of the same age. Servicing, insurance groups, tyres, the £54.85 MOT cap and VED at roughly £190 in the 111–130 g/km band all sit outside these tables too.
- Excluded: insurance, servicing, repairs, tyres and consumables
- Excluded: depreciation — roughly 15–25% in year one, about 50% over five years
- Excluded: VED (~£190 in the 111–130 g/km band) and the MOT fee cap of £54.85
- Included: fuel only, at the stated pump prices and 12,000 miles a year
How to run your own petrol vs diesel numbers
The data gives a strong starting point, but your own mileage and price ratio decide the outcome. Two inputs change the result more than any other: annual mileage and your local pump price gap. If diesel near you is cheaper than the national average the 11.8% threshold falls and more diesels become viable; if it is dearer, the case gets harder still. Everything else is a detail by comparison.
- Write down your realistic annual mileage, not your best-case year
- Divide your local diesel price by your local petrol price to get your own threshold
- Check your diesel candidate beats its petrol counterpart on official L/100km by more than that threshold
- Multiply the per-mile saving by your mileage to get the annual cash figure
- Add servicing, AdBlue and DPF exposure to the diesel side of the ledger
- Confirm your driving pattern includes enough sustained runs for DPF regeneration
- Compare any diesel purchase premium against the cumulative saving over the years you will keep the car
Petrol vs diesel in 2026: the verdict from 7,230 records
Diesel still wins on fuel cost for the typical UK car, but the margin has narrowed to a marginal decision rather than an obvious one. The average diesel costs £580 a year less than the average petrol, or £366 on medians, and diesel wins 2,064 of 2,148 like-for-like model-year pairs — 96%. The catch is that those averages include a great many thirsty petrol cars.
Narrow the question to the cars most people buy and the advantage nearly disappears: best diesel £1,078 a year against best petrol £1,140, just £62. The 2018 Volkswagen Golf diesel saves £12; the 2011–2012 Fiat 500 diesels cost £134 a year more. Diesel remains the right answer for high mileage in large, heavy vehicles — 2.63p a mile is unspectacular until multiplied by 25,000 miles. Everything else belongs to petrol, and the 1.1341 pump price ratio is what settles it.
- Diesel wins: 96% of like-for-like pairs, £316 a year at 12,000 miles on the median car
- Diesel loses: VW Golf £12, Fiat 500 £134 the other way, 2021 Nissan X-Trail £306
- The threshold: diesel must be 11.8% more efficient than petrol to break even at UK prices
- The rule of thumb: heavy car plus high mileage favours diesel; small car or low mileage favours petrol
All figures computed from UK VCA records at £1.64/L petrol, £1.86/L diesel and 12,000 miles a year. Scale linearly for your own mileage.
Use the free calculators
Frequently asked questions
Is diesel cheaper than petrol in the UK in 2026?
Diesel costs more per litre — £1.86 against £1.64, a 13.4% premium — but usually less per mile, because a diesel typically uses 20–30% less fuel. Across 7,230 official UK records the average diesel runs at £1,834 a year against £2,414 for petrol at 12,000 miles. The saving is real but modest on small cars.
How many miles a year do I need to make diesel worthwhile?
At the median saving in our data, 2.63p per mile, a £1,000 diesel purchase premium takes about 38,000 miles to recover — roughly three years at 12,000 miles a year. A £2,000 premium needs about 76,000 miles. Below 10,000 miles a year, most drivers never recover the premium on fuel alone.
Which is cheaper to run, a petrol or diesel small car?
Petrol. The best petrol car in the UK dataset costs £1,140 a year in fuel; the best diesel costs £1,078 — just £62 apart. The 2018 Volkswagen Golf diesel saves only £12 a year over its petrol version, and the 2011–2012 Fiat 500 diesel costs £134 a year more. Small cars favour petrol.
Why is the diesel advantage smaller than it used to be?
Two reasons. Diesel costs 13.4% more per litre than petrol in the UK, which forces diesel to be at least 11.8% more efficient just to break even. And modern small petrol engines are now so efficient that many petrol cars already sit at 4.0 L/100km or below, leaving no room for the diesel to beat them.
Do these figures include servicing, insurance or road tax?
No. Every table shows fuel cost only, at £1.64/L petrol, £1.86/L diesel and 12,000 miles a year. Insurance, servicing, AdBlue and DPF costs, tyres, depreciation (roughly 15–25% in year one) and VED are all excluded. Use the car cost calculator to add them for your own car.
Are the official consumption figures realistic?
They are consistent, not realistic. WLTP and NEDC tests run in a laboratory with no wind, passengers or air conditioning, so real-world consumption typically runs 10–25% higher for both fuels. Because the gap is proportional, the ranking between a petrol and a diesel car usually holds even though the absolute figures are optimistic.