EV vs Petrol Running Costs: The Real Numbers

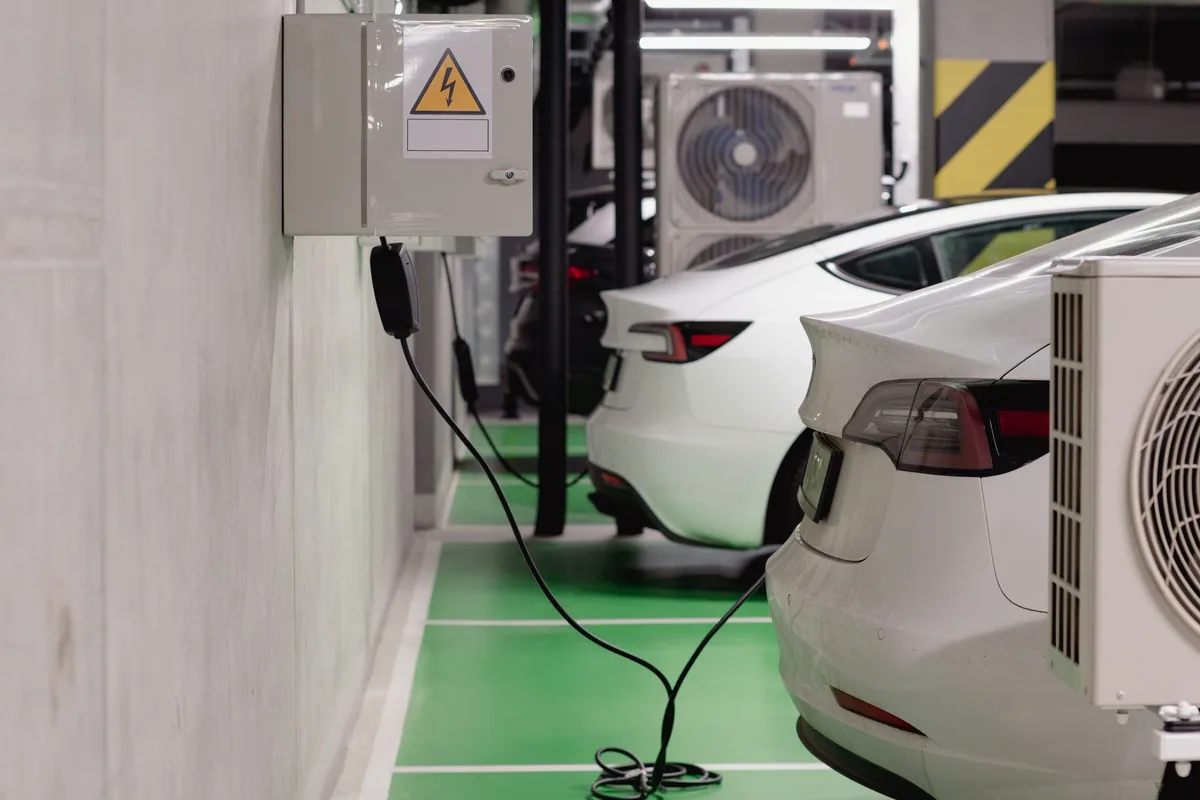
An EV vs petrol cost comparison is only as good as the consumption figures behind it, so this one is built on official UK Vehicle Certification Agency records: 8,034 liquid-fuel rows and 182 electric rows, priced at petrol £1.64 a litre and electricity £0.263 per kWh over 12,000 miles, then compared like with like across eight matched size classes.
On energy alone an electric car costs less to run than its petrol equivalent in every class we tested, but the size of the win depends on the class, whether you charge at home and how far you drive. This guide gives the leaderboards, the matched pairs and the break-even mileage, then the parts the fuel arithmetic cannot settle — purchase price, public charging, cold weather and servicing.
How this EV vs petrol running cost comparison was built
Every figure comes from the UK Vehicle Certification Agency database KnowCarCost holds: 8,034 type-approval rows for liquid-fuel cars and 182 for electric vehicles, model years 2000 to 2027. Five constants apply to every row so only the car varies: petrol £1.64 a litre, diesel £1.86 a litre, household electricity £0.263 per kWh, 12,000 miles a year and 1.609344 kilometres to the mile.
The formula is short enough to check by hand. Liquid fuel: litres per 100 km ÷ 100 × 1.609344 × 12,000 × the pump price. Electric: kWh per 100 km ÷ 100 × 1.609344 × 12,000 × £0.263. Prices are the verified UK figures for the week of 31 August 2026; the electricity rate is the Eurostat UK household figure, band DC, including taxes.
These are UK national averages applied to laboratory test-cycle consumption — a like-for-like comparison, not a forecast of your own bill.
Data quality: the six rows we removed before ranking anything
We keep only rows with a consumption figure inside a plausible band — 5.0 to 40.0 kWh per 100 km for electric, 2.5 to 25.0 litres per 100 km for liquid fuel. That removed four records: a 2018 Hyundai IONIQ at 1.1 L/100 km and a 2018 Kia Niro at 1.3, plug-in test figures that assume a full battery before every trip; a 2026 Toyota Land Cruiser at 26.2, outside the band; and a 2022 Mazda CX-60 at 141.2 L/100 km, a data-entry artefact.
Two more rows went from inside the band. A 2018 Land Rover Range Rover and a 2018 Range Rover Sport both carry 2.8 L/100 km — the official plug-in figure, sitting in the same table as ordinary combustion cars. Without a charged battery they are nowhere near that, so keeping them would have put two fictional economy champions at the top of the petrol ranking. Nothing was removed from the electric side: all 182 electric rows fall inside 5.0–40.0. A further 129 rows carry no consumption style, all plug-ins, and are excluded from both sides.
| Make | Model | Year | Recorded | Why it was removed |
|---|---|---|---|---|
| Hyundai | IONIQ | 2018 | 1.1 L/100km | Plug-in test figure, below band |
| Kia | Niro | 2018 | 1.3 L/100km | Plug-in test figure, below band |
| Toyota | Land Cruiser | 2026 | 26.2 L/100km | Above the 25.0 L/100km band |
| Mazda | CX-60 | 2022 | 141.2 L/100km | Data-entry artefact |
| Land Rover | Range Rover | 2018 | 2.8 L/100km | Mis-tagged plug-in figure |
| Land Rover | Range Rover Sport | 2018 | 2.8 L/100km | Mis-tagged plug-in figure |
The most efficient electric cars in the UK on home charging
The 2026 Mini Aceman leads at 10.9 kWh per 100 km: £554 a year over 12,000 miles at £0.263 per kWh, or 4.6p a mile. The 2026 Mercedes-Benz CLA Saloon follows at 12.2 kWh (£620) and the Dacia Spring at 12.5 (£635), then the Fiat 500 at 13.3 (£676), the Tesla Model 3 at 13.8 (£701) and a four-way tie at 14.2 kWh and £721 — Mini Cooper Electric, Peugeot 2008, Tesla Model Y and Volkswagen ID.7. Official range in those rows runs from 224 km for the Dacia Spring to 622 km for the Model Y and 791 km for the CLA Saloon.
The table is unusually flat: the whole 15-model leaderboard spans 10.9 to 14.8 kWh per 100 km, or £554 to £752 a year — only £198 between best and worst, though the list contains city cars, a family saloon and two mid-size SUVs. Efficiency does not track size: the Model 3 achieves 13.8 kWh with a 520 km official range, while the heavier Lexus RZ 350e needs 14.7 kWh.

The most efficient petrol cars in the UK
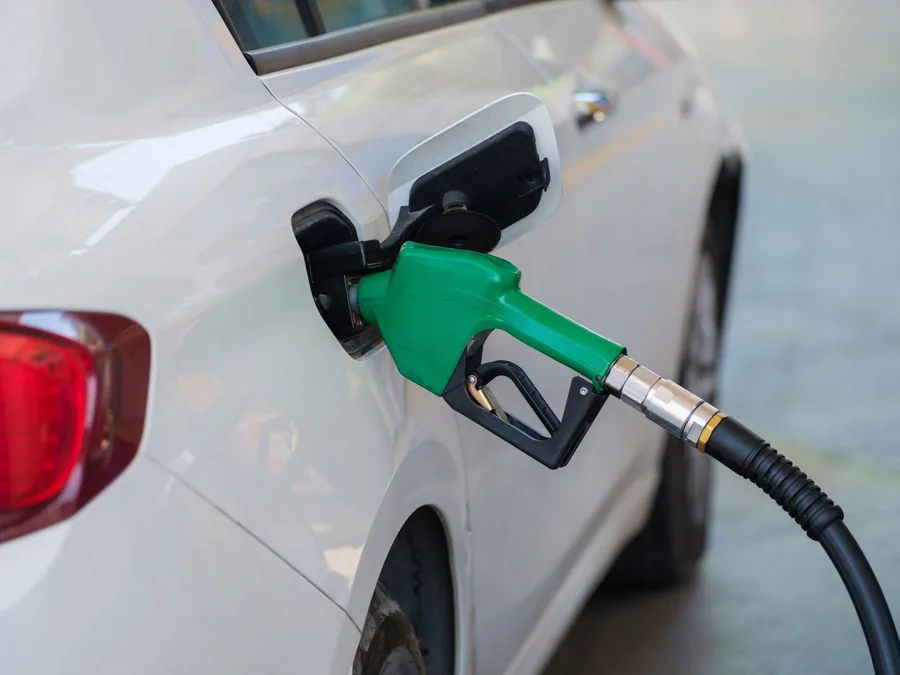
Two joint leaders at 3.0 L per 100 km and £950 a year at £1.64 a litre: the 2018 Toyota Prius at 70 g/km of CO2 and the 2017 Peugeot 208 at 79 g/km. The 2017 Peugeot 308 follows at 3.1 L/100 km (£982), then a cluster at 3.2 L/100 km and £1,014 — Ford Fiesta, Nissan Micra, Volkswagen Golf, Hyundai i20, Škoda Octavia, Citroën C4 Cactus and Kia Rio. Almost everything at the top is a small hatchback, a supermini or a hybrid, and that is physics rather than fashion.
Energy price does the rest. The most efficient electric car costs £0.046 per mile; the most efficient petrol car £0.079 — about 72% more for the same mile. Common petrol nameplates cannot close that gap: a 2018 Nissan Qashqai at 3.8 L/100 km costs £1,204 a year, a 2018 Ford Kuga at 4.4 costs £1,394 and a 2018 Land Rover Discovery Sport at 4.7 costs £1,489. A 50-litre fill-up at £1.64 a litre is £82, and the car it fills still runs at roughly twice the cost per mile of an EV on a home charger.
| Model | Year | L/100km | CO₂ | Annual | Per mile |
|---|---|---|---|---|---|
| Toyota Prius | 2018 | 3.0 | 70 g/km | £950 | £0.079 |
| Peugeot 208 | 2017 | 3.0 | 79 g/km | £950 | £0.079 |
| Peugeot 308 | 2017 | 3.1 | 82 g/km | £982 | £0.082 |
| Ford Fiesta | 2018 | 3.2 | 82 g/km | £1,014 | £0.084 |
| Nissan Micra | 2018 | 3.2 | 85 g/km | £1,014 | £0.084 |
| Renault Clio Sport Tourer | 2018 | 3.2 | 84 g/km | £1,014 | £0.084 |
| Volkswagen Golf | 2014 | 3.2 | 85 g/km | £1,014 | £0.084 |
| Škoda Octavia | 2014 | 3.2 | 85 g/km | £1,014 | £0.084 |
| Kia Rio | 2014 | 3.2 | 85 g/km | £1,014 | £0.084 |
What the average petrol, diesel, hybrid and electric car really costs
Averages show the shape of the market. Across 4,103 petrol-tagged rows in band the mean is 7.62 L/100 km, which costs £2,414 a year. Diesel looks stronger on 3,127 rows averaging 5.11 L/100 km, but at £1.86 a litre that is still £1,836. Non-plug hybrids average 6.13 L/100 km over 417 rows (£1,941), and the 381 in-band plug-in rows average 6.27 L/100 km (£1,986).
The 179 unique electric records average 17.43 kWh per 100 km: £885 a year, £0.074 per mile, or 43% of the £2,060 that the 7,444 unique liquid-fuel records average — a £1,175 annual gap on energy alone. The best diesel we hold, a 2017 Peugeot 208 at 3.0 L/100 km, still costs £1,078 a year at £1.86 a litre, and the most efficient hybrid, the 2018 Toyota Prius at 3.0 L/100 km, costs £950 — both well above the £554 of the best electric car.
| Powertrain | Rows in band | Mean consumption | Price used | Annual |
|---|---|---|---|---|
| Petrol | 4,103 | 7.62 L/100km | £1.64/L | £2,414 |
| Diesel | 3,127 | 5.11 L/100km | £1.86/L | £1,836 |
| Hybrid (non-plug) | 417 | 6.13 L/100km | £1.64/L | £1,941 |
| Plug-in hybrid | 381 | 6.27 L/100km | £1.64/L | £1,986 |
| Electric | 179 | 17.43 kWh/100km | £0.263/kWh | £885 |
What those averages hide about EV running costs
Averages hide the spread, and the spread is where the money is. In-band electric consumption runs 10.9 to 30.3 kWh per 100 km — £554 to £1,539 a year. In-band liquid fuel runs 3.0 to 23.7 L per 100 km — £950 to £7,506 a year, because the liquid table runs from city cars to supercars. The least efficient electric car we hold still costs 36% less in energy each year than the average petrol car.
Choosing between EVs is mostly about space, range and equipment — the energy difference is small. Choosing between petrol cars is where the money is.
Matched same-class EV vs petrol pairs: the honest comparison
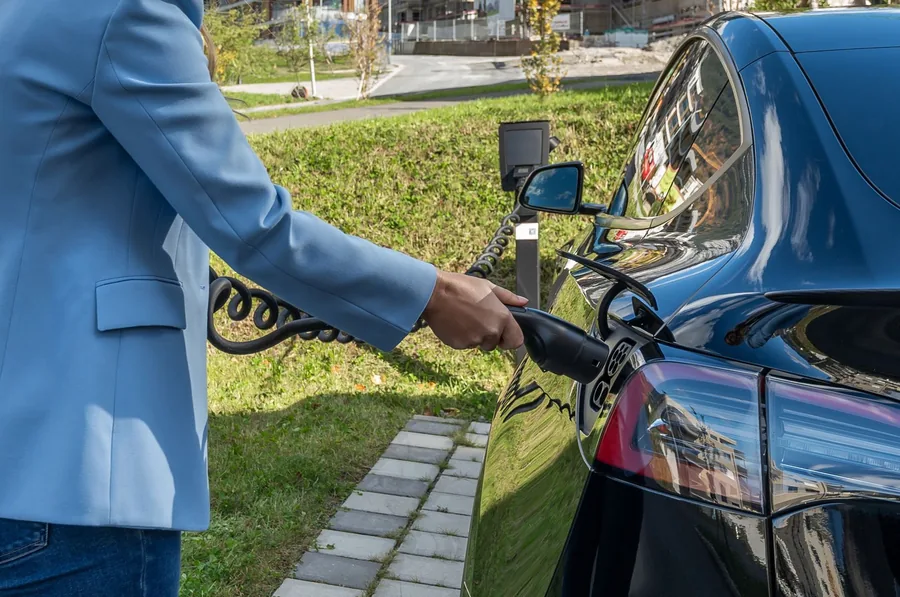
Comparing a Mini Aceman with a McLaren tells you nothing, so we built eight matched pairs. Each uses the most efficient in-band UK VCA row we hold for the same nameplate or size class on both sides, at 12,000 miles with petrol at £1.64 a litre and home charging at £0.263 per kWh.
Electric wins all eight, by amounts that vary sharply. The biggest gap is the family saloon pair: a 2026 Tesla Model 3 at 13.8 kWh costs £701 a year against £1,679 for a 2021 Toyota Camry at 5.3 L/100 km — £978, or 58%. The tightest is the family hatchback pair: a 2026 Volkswagen ID.3 at 15.6 kWh costs £792 against £1,014 for a 2014 Golf at 3.2 L/100 km — £221, or 22%. Across the eight pairs the saving runs from £221 to £978.
| Class | EV model | kWh/100km | EV £/yr | Petrol model | L/100km | Petrol £/yr | Saving |
|---|---|---|---|---|---|---|---|
| City car | Dacia Spring | 12.5 | £635 | Hyundai i10 | 4.0 | £1,267 | £632 |
| Supermini | Mini Cooper Electric | 14.2 | £721 | Fiat 500 | 3.4 | £1,077 | £356 |
| Small SUV | Peugeot 2008 | 14.2 | £721 | Peugeot 2008 | 3.5 | £1,109 | £387 |
| Compact crossover | Hyundai Kona Electric | 14.3 | £726 | Hyundai Kona | 4.2 | £1,330 | £604 |
| Crossover | Kia Niro EV | 16.2 | £823 | Kia Niro | 3.7 | £1,172 | £349 |
| Family hatchback | Volkswagen ID.3 | 15.6 | £792 | Volkswagen Golf | 3.2 | £1,014 | £221 |
| Family saloon | Tesla Model 3 | 13.8 | £701 | Toyota Camry | 5.3 | £1,679 | £978 |
| Mid-size SUV | Tesla Model Y | 14.2 | £721 | Volvo XC60 | 4.5 | £1,425 | £704 |
City cars: the widest gap between an EV and its petrol equivalent
The city car pair shows the energy gap at its clearest. A 2026 Dacia Spring at 12.5 kWh costs £635 a year at home rates, while a 2017 Hyundai i10 at 4.0 L/100 km costs £1,267 at £1.64 a litre: £632 a year, or 50%, for the same 12,000 miles. Per mile it is £0.053 against £0.106, from a car with a 224 km official range — realistically an urban machine rather than a motorway cruiser.
Family saloons and mid-size SUVs: the biggest EV savings
The largest savings appear where the petrol equivalent carries the most weight. A 2026 Tesla Model Y at 14.2 kWh costs £721 a year against £1,425 for a 2017 Volvo XC60 at 4.5 L/100 km — £704 saved. A 2023 Hyundai Kona Electric at 14.3 kWh costs £726 against £1,330 for a 2018 Kona at 4.2 L/100 km — £604 saved. The family saloon pair saves £978 and the compact crossover pair still saves £349.
A £978 annual saving is worth about 596 litres of petrol at £1.64 a litre — roughly 12 full 50-litre tanks, every year.
Home charging vs public charging: the biggest single variable
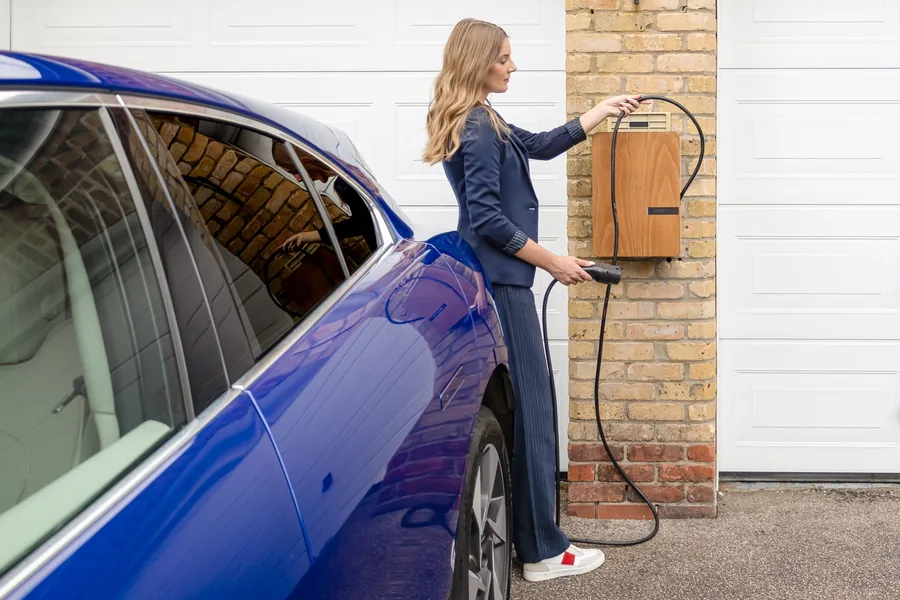
Every electric figure here assumes home charging at the verified UK household rate of £0.263 per kWh, and that assumption carries most of the weight: because the car sits on the driveway for hours, a wallbox and an overnight routine cover most daily driving.
Public charging is a different product: a retail site with network costs, demand charges, site rent, maintenance and payment processing behind the price, so it cannot be sold at the domestic commodity rate. We hold no verified UK public tariff and will not invent one, so the table expresses annual public charging as explicit multiples of the home figure — 1.5x, 2x and 3x — labelled as assumptions. Read them as sensitivity tests, then check local rates.
| Model | kWh/100km | Home £/yr | 1.5x £/yr | 2x £/yr | 3x £/yr | 3x per mile |
|---|---|---|---|---|---|---|
| Mini Aceman | 10.9 | £554 | £830 | £1,107 | £1,661 | £0.138 |
| Mercedes-Benz CLA Saloon | 12.2 | £620 | £929 | £1,239 | £1,859 | £0.155 |
| Dacia Spring | 12.5 | £635 | £952 | £1,270 | £1,905 | £0.159 |
| Fiat 500 | 13.3 | £676 | £1,013 | £1,351 | £2,027 | £0.169 |
| Tesla Model 3 | 13.8 | £701 | £1,051 | £1,402 | £2,103 | £0.175 |
| Mini Cooper Electric | 14.2 | £721 | £1,082 | £1,442 | £2,164 | £0.180 |
The 1.5x, 2x and 3x columns are stated assumptions, not quoted tariffs. We hold no verified UK public charging price, so we do not publish one.
The charging multiple at which the EV advantage disappears
The 3x column matters most, because that is roughly where an electric car's energy advantage stops existing against an efficient petrol car. For each matched pair we divided petrol annual cost by electric home cost to find the multiple at which they meet: the answer ranges from 1.28x to 2.39x, which explains why two drivers of the same car can have opposite experiences.
A Tesla Model 3 against a Toyota Camry survives a 2.39x multiple before the advantage vanishes. A Volkswagen ID.3 against an efficient 2014 Golf survives only 1.28x: at three times the home rate the ID.3 costs £2,376 a year in electricity against the Golf's £1,014 — a £1,362 penalty for switching. Home charging is therefore the first question to answer, before any model comparison.
| Class | EV home cost | Petrol cost | Multiple that erases the saving |
|---|---|---|---|
| City car | £635 | £1,267 | 2.00x home |
| Supermini | £721 | £1,077 | 1.49x home |
| Small SUV | £721 | £1,109 | 1.54x home |
| Compact crossover | £726 | £1,330 | 1.83x home |
| Crossover | £823 | £1,172 | 1.42x home |
| Family hatchback | £792 | £1,014 | 1.28x home |
| Family saloon | £701 | £1,679 | 2.39x home |
| Mid-size SUV | £721 | £1,425 | 1.98x home |
Why EVs win on running cost but not on purchase price
Everything above concerns energy and a few fixed costs. It says nothing about what the car costs to buy, which is where the electric case usually gets harder: we hold no verified UK sticker prices, so this guide makes no purchase-price claim and does not pretend a £978 energy saving justifies any given premium.
Energy is also only one line in the ownership budget, and rarely the largest for a private buyer. A typical new car loses roughly 15% to 25% of its value in the first year and about 50% over five years, often more than several years of fuel. Insurance varies hugely by driver, postcode and repair cost, and electric cars can be dearer to insure because of battery and electronics repair complexity.
So read this as a running-cost comparison, not a verdict: the energy line leans electric, usually by hundreds of pounds a year. Whether that becomes a saving depends on the premium, the finance terms, the insurance quote and how long you keep the car.
Break-even mileage: how long an EV premium takes to repay
Break-even is simple arithmetic: premium divided by annual saving gives years at 12,000 miles a year. Because we hold no verified purchase prices, the premiums below — £2,000, £4,000 and £6,000 — are round illustrative figures used only to show how the maths behaves; the savings come from the dataset.
Where the saving is large the payback is quick: the family saloon pair clears £4,000 in 4.1 years, about 49,000 miles, and £6,000 in 6.1 years. The family hatchback pair needs 18.1 years, roughly 217,000 miles, to recover £4,000. Public charging stretches it further: on the saloon pair 1.5x the home rate pushes a £4,000 payback to 6.4 years and 2x to 14.5 years, while at 3x the electric car costs £2,103 a year against £1,679, so the premium is never recovered on energy.
| Class | Saving £/yr | £2,000 premium | £4,000 premium | £6,000 premium |
|---|---|---|---|---|
| City car | £632 | 3.2 yr | 6.3 yr | 9.5 yr |
| Supermini | £356 | 5.6 yr | 11.2 yr | 16.9 yr |
| Small SUV | £387 | 5.2 yr | 10.3 yr | 15.5 yr |
| Compact crossover | £604 | 3.3 yr | 6.6 yr | 9.9 yr |
| Crossover | £349 | 5.7 yr | 11.5 yr | 17.2 yr |
| Family hatchback | £221 | 9.0 yr | 18.1 yr | 27.1 yr |
| Family saloon | £978 | 2.0 yr | 4.1 yr | 6.1 yr |
| Mid-size SUV | £704 | 2.8 yr | 5.7 yr | 8.5 yr |
The premiums are illustrative; the savings are not — they come from official VCA consumption at £1.64/L and £0.263/kWh.
Cold weather and motorway driving: two penalties the tables cannot show
Official consumption is measured under controlled conditions, and cold weather is the biggest thing it misses for an electric car. A cold battery accepts charge more slowly and delivers less usable energy, cabin heating draws from the pack rather than from waste engine heat, and denser air plus winter tyres add resistance, so real winter consumption is materially higher than the certified figure. We hold no verified UK figure for that penalty, so we put no percentage on it. A petrol car also burns more in winter, but its engine supplies cabin heat free, so its penalty is proportionally smaller.
The reverse happens on motorways. Electric cars are most efficient in low-speed, stop-start driving, where regenerative braking recovers energy a petrol car turns into brake heat. At a steady cruise, drag rises with the square of speed and there is little braking to recover, so consumption climbs and an efficient petrol or diesel car looks comparatively better. Official cycles include motorway segments, but not a constant 70 mph run in January with the heater on: the EV advantage is widest in town and narrowest on a long haul.
Servicing, brakes and tyres: what changes and what does not
Servicing quietly strengthens the electric case. An electric car has no engine oil, oil filter, spark plugs, timing belt, exhaust or clutch, so the routine list is short: brake fluid, cabin filters, coolant for battery thermal management on some models, tyres, and inspection of suspension, steering and electrics. A petrol car adds oil and filter changes, plugs, belts and emissions hardware, each with a service life and a failure mode.
Regenerative braking means the friction brakes do much less work, so pads and discs last longer — we hold no UK figure for how much longer and will not invent one. Weight is the honest counter-argument: heavy packs and instant torque wear tyres faster, so an EV likely spends less on brakes and more on tyres. Neither difference should decide a purchase alone.
VED and the MOT: the two fixed costs we keep separate
Two annual costs sit outside everything above. Vehicle excise duty: the ~£190 a year reference figure applies to the 111–130 g/km band, which covers many petrol cars shown here, while cleaner models sit in lower bands or are exempt depending on first-registration date. MOT: capped at £54.85, payable once a car reaches three years old and every year after.
Neither is added to any fuel or electricity total here. Mixing a flat tax into a per-mile energy comparison makes two different costs look like one and hides the fact that VED varies by car while energy cost varies by car and by mile. Add both yourself for a total-cost picture, and check the current VED band for the exact model year rather than assuming £190 applies.
VED ~£190/yr for the 111–130 g/km band and the £54.85 MOT cap are reference figures only, excluded from every energy total in this guide.
What these EV vs petrol figures do not include
Every number here estimates one thing: the cost of energy that moves the car, at verified UK prices, using official test-cycle consumption over 12,000 miles. It is not a total cost of ownership figure and not financial advice. Insurance, servicing, repairs, tyres, finance, depreciation, VED beyond the £190 band and MOT fees beyond the £54.85 cap are excluded, and public charging is shown only as a multiple of the home rate.
Two limits are worth stating plainly. Laboratory consumption is not real-world consumption: no test cycle includes a cold January morning, a roof box or a headwind, and the certified-to-real gap is larger for EVs in winter. Our dataset is what the UK VCA certified, so a car with no row there has no figure here. Use these tables to compare cars, then use your own mileage, tariff and quotes.
How to calculate your own EV vs petrol running costs
The formula takes a minute and is worth doing before you sign anything: the difference between a 6,000-mile driver with a driveway and a 20,000-mile driver on public chargers is larger than the difference between most cars in these tables.
- Use your real annual mileage, not the 12,000-mile average used here
- Multiply your current car's litres per 100 km by your pump price and mileage
- Multiply the EV's kWh per 100 km by your home rate, your public charging mix and mileage
- Subtract the two annual figures, then divide any premium by the saving for years to break-even
- Add fixed costs separately — servicing, tyres, insurance quotes, VED and MOT
Use the free calculators
Frequently asked questions
How much cheaper is it to run an electric car than a petrol car in the UK?
It depends on the class and on charging at home. At £0.263/kWh and £1.64/L over 12,000 miles, the most efficient electric car we hold costs £554 a year against £950 for the best petrol car. Across our eight matched pairs the saving runs from £221 to £978.
Is an electric car cheaper if I cannot charge at home?
Often not. Public charging costs a multiple of the domestic rate, and we hold no verified UK public tariff, so we tested 1.5x, 2x and 3x as assumptions. A Volkswagen ID.3 beats an efficient 2014 petrol Golf only up to about 1.28x the home rate; beyond that the petrol car is cheaper.
Why do electric cars cost less to run but more to buy?
Electricity at £0.263/kWh is far cheaper per unit of energy than petrol at £1.64/L, and an electric motor converts more of it into motion. Purchase prices are driven by battery cost and market positioning, and we hold no verified UK sticker prices, so no purchase-price claim is made here.
Does cold weather really reduce electric car range?
Yes. Cold cells deliver less usable energy, cabin heating draws from the pack rather than from waste engine heat, and winter tyres plus denser air add resistance, so real consumption rises above the certified figure. We hold no verified UK percentage for that penalty, so it is described qualitatively here and never quantified.
Are electric cars cheaper to service and to brake?
The routine service list is shorter: no oil, oil filter, spark plugs, timing belt, exhaust or clutch. Regenerative braking means friction pads and discs do less work and last longer. We hold no verified UK servicing costs, and heavier weight plus instant torque increases tyre wear, so treat it as a direction of travel.
Does a plug-in hybrid give the best of both worlds?
Only if you charge it. Official plug-in figures assume a full battery before every trip, which is why we removed two 2018 Range Rover rows at 2.8 L/100km from the petrol ranking. Our 381 in-band plug-in rows average 6.27 L/100km and cost £1,986 a year — more than the £1,941 non-plug hybrid average.
How many miles do I need to drive for an EV to pay back its premium?
Divide the premium by the annual energy saving, then convert years to miles at 12,000 a year. On our family saloon pair a £4,000 premium repays in 4.1 years, about 49,000 miles; on the family hatchback pair the same premium takes 18.1 years and roughly 217,000 miles. The premiums are illustrative because we hold no verified purchase prices.
What do these running cost figures exclude?
Insurance, servicing, repairs, tyres, finance, depreciation, VED beyond the ~£190 reference band and MOT fees beyond the £54.85 cap. Public charging is excluded as a price and expressed only as a multiple of the home rate. The figures are estimates from official test-cycle consumption, not financial advice.