What it really costs to own a car in Belgium

The cost of owning a car in Belgium comes down to one odd fact: diesel is far dearer at the pump than petrol, and always has been. At €2.208 a litre against €1.885, Belgian diesel carries a 17.1% price premium over E95, so a diesel car only saves money if its engine is efficient enough to cancel that out. Everything else — energy, road tax, inspection, insurance and depreciation — sits around that single relationship.
This guide prices 17,130 official vehicle records at Belgian energy prices and 15,000 km a year, then adds the costs we can verify: the regional verkeersbelasting, the keuring, and depreciation. Where a cost genuinely varies — insurance, tyres, repairs, parking — we say so instead of inventing an average.
What owning a car in Belgium costs in 2026
Fuel is not the biggest line for anyone who bought their car new, but it is the line most drivers can measure. On our Belgian model a typical petrol car burns €2,411 of fuel a year at 15,000 km, a diesel €1,933, a non-plug hybrid €1,720 and an electric car €917 of household electricity.
The table below is the whole guide in miniature. Every figure is either measured from the vehicle records we hold or taken from a verified Belgian constant.
| Cost line | Typical annual figure | Basis |
|---|---|---|
| Fuel or electricity (15,000 km) | €917–€2,411 | Our model on official VCA data |
| Verkeersbelasting (road tax) | about €270 typical | Regional tariff, indexed each 1 July |
| Keuring / contrôle technique | about €46 | Flanders tariff |
| Depreciation | 15–25% in year one | Approximate market behaviour |
| Insurance, tyres, servicing, parking | varies | No verified Belgian average |
Energy figures below assume 15,000 km a year and Belgian prices of €1.885/L petrol, €2.208/L diesel and €0.35/kWh household electricity.
How these Belgian running-cost figures were built
The numbers come from 17,141 official UK Vehicle Certification Agency type-approval records, model years 2000 to 2027. We removed records below 2.5 or above 25.0 L/100km, electric records below 5.0 or above 40.0 kWh/100km, and hybrid-tagged rows under 3.0 L/100km, which are almost always plug-in hybrids wearing the wrong label. That left 17,130 records.
Each record was then priced as if it were driven in Belgium: consumption divided by 100, multiplied by 15,000 km, multiplied by €1.885 for petrol, €2.208 for diesel or €0.35 for a kilowatt-hour of household electricity. Hybrids are priced as petrol cars.
Using one distance and one price set, the tables rank vehicles on certified efficiency alone. At 20,000 km the averages become €3,215 for petrol, €2,577 for diesel and €1,222 for electric.
These are certified laboratory figures. Real-world consumption is typically 10–25% higher, and more in winter for electric cars.
Petrol versus diesel: the Belgian pump-price squeeze
Belgium is one of the few markets where diesel is the expensive fuel. Petrol averages €1.885 a litre and diesel €2.208 — a 17.1% premium, so a 50-litre fill costs €94.25 in petrol and €110.40 in diesel. Both sit above the EU averages of €1.840 and €1.966 (European Commission Oil Bulletin, 31 August 2026).
That premium sets the bar for every diesel on the road: a diesel engine must use no more than 85.4% of the litres a petrol car does before the two cost the same to fuel. Our data clears that bar on average, but about one diesel record in four still costs more per kilometre than a middling petrol car.
| Fuel | Belgian price | 50-litre fill | EU average |
|---|---|---|---|
| Petrol (E95) | €1.885/L | €94.25 | €1.840/L |
| Diesel | €2.208/L | €110.40 | €1.966/L |
| Household electricity | €0.35/kWh | n/a | €0.220/kWh |
Pump prices are national averages including all taxes, from the EU Oil Bulletin. Electricity is Eurostat household band DC data, H2 2025.
Data quality: the 11 records we excluded
Any ranking is only as good as its cleaning step, and the source files contain artefacts. Nine petrol and diesel records were dropped as implausible or as cycle quirks: a 2026 Toyota Land Cruiser hybrid at 26.2 L/100km, a 2007 Kia Sorento diesel at 35.8 L/100km, a 2022 Mazda CX-60 petrol at 141.2 L/100km and six plug-in hybrids at 1.1 to 2.1 L/100km.
Two further rows are hybrids in name only: a 2018 Range Rover and Range Rover Sport, both at 2.8 L/100km. That is the official plug-in test figure, taken with a full battery and the engine off for most of the cycle, and no owner will see it on a Belgian motorway. We dropped both rather than let them drag the hybrid average down.
- Mazda CX-60 2022 petrol — 141.2 L/100km, a data-entry error
- Kia Sorento 2007 diesel — 35.8 L/100km
- Toyota Land Cruiser 2026 hybrid — 26.2 L/100km
- Six plug-in hybrids (Volt, Prius, Ampera, V60, Ioniq, Niro) — 1.1 to 2.1 L/100km
- Range Rover and Range Rover Sport 2018 — 2.8 L/100km, plug-in mis-tags
The 402 plug-in hybrids that survived the filter are counted separately, never mixed into petrol or hybrid averages.
Annual energy cost by powertrain: mean and median
Across 17,130 records the petrol mean is €2,411 a year and the median €2,205. The gap matters: the mean is dragged upward by large SUVs and performance cars, so the median is the fairer test of what a typical owner pays. Diesel averages €1,933 and medians €1,822, hybrids €1,720 and €1,654, electric cars €917 and €887.
On medians, a diesel costs €383 a year less in energy than a petrol car, a hybrid €551 less and an electric car €1,318 less. Electricity is also the only powertrain where even the thirstiest model beats the average petrol car: the least efficient EV we hold costs €1,591 a year.
| Powertrain | Records | Mean consumption | Mean €/yr | Median €/yr | Mean €/100 km |
|---|---|---|---|---|---|
| Petrol | 9,201 | 8.53 L/100km | €2,411 | €2,205 | €16.07 |
| Diesel | 6,855 | 5.84 L/100km | €1,933 | €1,822 | €12.88 |
| Hybrid (non-plug) | 490 | 6.08 L/100km | €1,720 | €1,654 | €11.47 |
| Electric | 182 | 17.46 kWh/100km | €917 | €887 | €6.11 |
| Plug-in hybrid | 402 | 6.19 L/100km | €1,749 | €1,696 | €11.66 |
Plug-in hybrids are shown for completeness but sit outside the ranked averages: their figures assume a full battery on every trip.
Cost per 100 km: the figure that travels with you
Cost per 100 km is the cleanest way to compare cars you will drive different distances. The average petrol car in our data costs €16.07 per 100 km, the average diesel €12.88, the average hybrid €11.47, and the average electric car €6.11 at Belgian household rates. Medians sit a little lower at €14.70, €12.14, €11.03 and €5.91.
That is the honest scale of the diesel-versus-petrol question: €3.19 per 100 km, or €383 a year at 15,000 km. Over five years the median gap is €1,915 — real money, but less than the value a new car loses in its first year, and before any difference in servicing bills.
Cost per 100 km is annual energy cost divided by 150. Reprice it at your own pump or tariff with the fuel cost calculator.
The cheapest cars to run in the Belgian data
The cheapest petrol car in the dataset is the first-generation Honda Insight at 3.4 L/100km, which is €961 a year at Belgian prices, followed by the 2017 Suzuki Celerio at €1,018 and the 2018 Fiat 500 at €1,074. Diesel's leader is the 2017 Peugeot 208 at €994, with the Peugeot 308 and Ford Fiesta just behind.
Hybrids take the overall combustion crown: a Toyota Prius at 3.0 L/100km costs €848 a year, the cheapest petrol-burning car in the database. Electricity still wins outright — the 2026 Mini Aceman at 10.9 kWh/100km costs €572 a year, €389 less than the cheapest petrol car.
| Powertrain | Model | Year | Consumption | Energy per year |
|---|---|---|---|---|
| Petrol | Honda Insight | 2000 | 3.4 L/100km | €961 |
| Petrol | Suzuki Celerio | 2017 | 3.6 L/100km | €1,018 |
| Diesel | Peugeot 208 | 2017 | 3.0 L/100km | €994 |
| Diesel | Peugeot 308 | 2017 | 3.1 L/100km | €1,027 |
| Hybrid | Toyota Prius | 2018 | 3.0 L/100km | €848 |
| Hybrid | Toyota Yaris | 2018 | 3.3 L/100km | €933 |
| Electric | Mini Aceman | 2026 | 10.9 kWh/100km | €572 |
| Electric | Dacia Spring | 2026 | 12.5 kWh/100km | €656 |
Why a 2000s Honda Insight still tops the petrol table
The Insight was the first hybrid sold in Europe and its 3.4 L/100km sits at the edge of what our filters allow. It is included because the figure is official and reproducible, not as a recommendation. The structural point: the cheapest petrol car in the 2000 records and the cheapest in 2026 are separated by 0.4 L/100km, while the average petrol car now uses 8.53 L/100km.
Efficiency has not stood still, but the market has shifted towards larger, heavier cars and the average followed. A driver who picks a supermini over a mid-size SUV saves more than half the average petrol car's fuel bill — 3.6 against 8.53 L/100km — before changing how they drive.
Small cars also sit in lower CO₂ bands: mean CO₂ is 199.8 g/km for petrol, 154.2 for diesel and 138.2 for hybrid.
The most expensive cars to run in Belgium
At the other extreme a Lamborghini Diablo at 24.9 L/100km costs €7,040 a year in petrol, with the 2026 McLaren GT at 23.7 L/100km and €6,701 and the 2005 Maserati MC12 at 23.0 L/100km and €6,503 behind it. The spread between the cheapest and thirstiest petrol car is €6,079 a year.
Diesel's heaviest drinkers are workhorses, not supercars: the 2026 INEOS Grenadier and the 2004 Volkswagen Touareg both sit at 12.2 L/100km and €4,041 a year. On the electric side the least efficient car we hold — a 2026 Mercedes-Benz G-Class at 30.3 kWh/100km — still costs €1,591, less than the average diesel.
| Powertrain | Model | Year | Consumption | Energy per year |
|---|---|---|---|---|
| Petrol | Lamborghini Diablo | 2000 | 24.9 L/100km | €7,040 |
| Petrol | McLaren GT | 2026 | 23.7 L/100km | €6,701 |
| Petrol | Maserati MC12 | 2005 | 23.0 L/100km | €6,503 |
| Diesel | INEOS Grenadier | 2026 | 12.2 L/100km | €4,041 |
| Diesel | Volkswagen Touareg | 2004 | 12.2 L/100km | €4,041 |
| Electric | Mercedes-Benz G-Class | 2026 | 30.3 kWh/100km | €1,591 |
Why diesel still wins on kilometres in Belgium
Set the Belgian pump premium beside the efficiency gap and diesel still comes out ahead on energy. The average diesel uses 5.84 L/100km against 8.53 L/100km for petrol — 31.5% fewer litres, more than enough to cover a 17.1% price premium. That gives €12.88 per 100 km against €16.07, and 73.1% of the diesel records we hold (5,013 of 6,855) cost less per kilometre than the median petrol car.
Annually that is €1,933 against €2,411, a €478 saving at 15,000 km — and the margin is thinner than the consumption figures suggest. If Belgian diesel were priced like petrol the same average diesel would cost €1,650 a year, so the pump premium costs about €283 annually. Diesel pays off on distance; at low mileage the higher purchase price rarely comes back.
| Comparison | Petrol | Diesel |
|---|---|---|
| Mean consumption | 8.53 L/100km | 5.84 L/100km |
| Pump price | €1.885 per litre | €2.208 per litre |
| Cost per 100 km | €16.07 | €12.88 |
| Energy per year at 15,000 km | €2,411 | €1,933 |
| Break-even requirement | reference | must use 85.4% of the litres |
Hybrids: the quiet middle ground
Non-plug hybrids average 6.08 L/100km against 8.53 L/100km for petrol. At Belgian petrol prices that is €1,720 a year against €2,411 — €691 saved, with no charging cable and no larger battery to worry about. On medians the gap is €551.
Hybrids test well because the certified cycle contains plenty of stopping and starting, where regenerative braking and engine-off running pay off. On a steady motorway cruise the advantage narrows, because there is little braking energy to recover. Toyota takes the four cheapest places in our hybrid table, which is worth knowing if you shop second-hand.
Hybrids burn petrol, so they carry the petrol price and none of diesel's 17.1% premium.
Electric cars: €917 a year in household electricity
The 182 electric records average 17.46 kWh/100km, which at €0.35 per kWh is €917 a year at 15,000 km, or €6.11 per 100 km. The cheapest is the 2026 Mini Aceman at 10.9 kWh/100km and €572, followed by the Mercedes-Benz CLA Saloon at €640, the Dacia Spring at €656, the 2025 Fiat 500 at €698 and the 2026 Tesla Model 3 at €724.
Even the least efficient electric car we hold is cheap to feed: €1,591 a year for a 30.3 kWh/100km Mercedes-Benz G-Class. That is more than the cheapest petrol car's whole fuel bill but less than the average diesel, and a full 60 kWh home charge costs about €21.
| Model | Year | Consumption | Energy per year | Cost per 100 km |
|---|---|---|---|---|
| Mini Aceman | 2026 | 10.9 kWh/100km | €572 | €3.81 |
| Mercedes-Benz CLA Saloon | 2026 | 12.2 kWh/100km | €640 | €4.27 |
| Dacia Spring | 2026 | 12.5 kWh/100km | €656 | €4.38 |
| Fiat 500 | 2025 | 13.3 kWh/100km | €698 | €4.66 |
| Tesla Model 3 | 2026 | 13.8 kWh/100km | €724 | €4.83 |
| Mercedes-Benz G-Class | 2026 | 30.3 kWh/100km | €1,591 | €10.61 |
Charging at home versus charging in public
Every electric figure above assumes you charge at home. Public rapid charging is priced by the network, not by the household tariff, and varies with the operator, connector speed and subscription. We have no verified Belgian average, so we do not quote one — but an EV run mostly on public fast charging costs noticeably more per kilometre than the same car charged overnight.
The gap can flip the petrol-versus-electric answer for drivers without a driveway or workplace charger, so treat the electric table as a best case and check current local tariffs first.
Belgian household electricity averages €0.35/kWh including taxes and levies, against an EU average of €0.220/kWh.
Verkeersbelasting: the road tax you cannot average
The annual verkeersbelasting — taxe de circulation, or rijtaks — is set regionally. Flanders, Wallonia and Brussels each run their own tariff and indexation, so the same car can produce different bills on either side of a regional border. A typical car costs about €270 a year, but treat that as an order of magnitude for budgeting, not a quote for your postcode.
The tax is also an emissions instrument: cars registered since 2016 are assessed on fiscal horsepower modulated by CO₂ emissions, fuel type and Euro standard, and electric vehicles are treated differently by region. We hold no verified tariff for any single region, so we do not invent one — look up the fiscal horsepower on your registration certificate and use your region's calculator.
- Flanders, Wallonia and Brussels set separate tariffs and separate indexation rules
- Fiscal horsepower is the base unit; CO₂, fuel type and Euro standard set the rate for cars registered from 2016
- Rates are indexed each 1 July, so winter figures go stale
- Electric cars are treated differently by region — check before budgeting the saving
About €270 a year is used throughout this guide as a typical figure, labelled an estimate, because no single number fits all three regions.
Contrôle technique and keuring: about €46
Cars in Belgium face a periodic technical inspection: the keuring in Flanders, the contrôle technique in Wallonia and Brussels. The standard check is about €46 in Flanders, and inspection bodies publish their tariffs, so this is one line you can budget precisely.
The published fee is not the whole story. Inspection centres are independent of repair workshops, so a failed test means a second fee plus repairs before the car is legal again. Worn tyres, brakes and suspension are the usual causes. The part you control is preparation: check tyres, lights, wipers and brakes beforehand, because a re-inspection costs another fee and another morning.
Belgium's inspection fee is among the cheaper ones in Europe: the Netherlands charges about €65 for its APK and France about €78.
Insurance: the line we will not invent
Insurance is the most personal line in any Belgian car budget. Age, claims history, postcode, annual mileage, the car's insurance group and whether the policy sits with an employer all move the premium more than any national average could capture. Insurers also package legal assistance, breakdown cover and occupant protection differently, which is why two quotes for the same car and driver can differ by hundreds of euros.
We hold no verified Belgian insurance average and do not quote one. Get two or three quotes for your shortlist before you buy, not after: an insurance difference of a few hundred euros can wipe out the annual fuel saving that made you choose one model over another.
Insurance, tyres, servicing, repairs and parking are excluded from every total here. Only energy, road tax, inspection and depreciation are priced.
Tyres, servicing and repairs
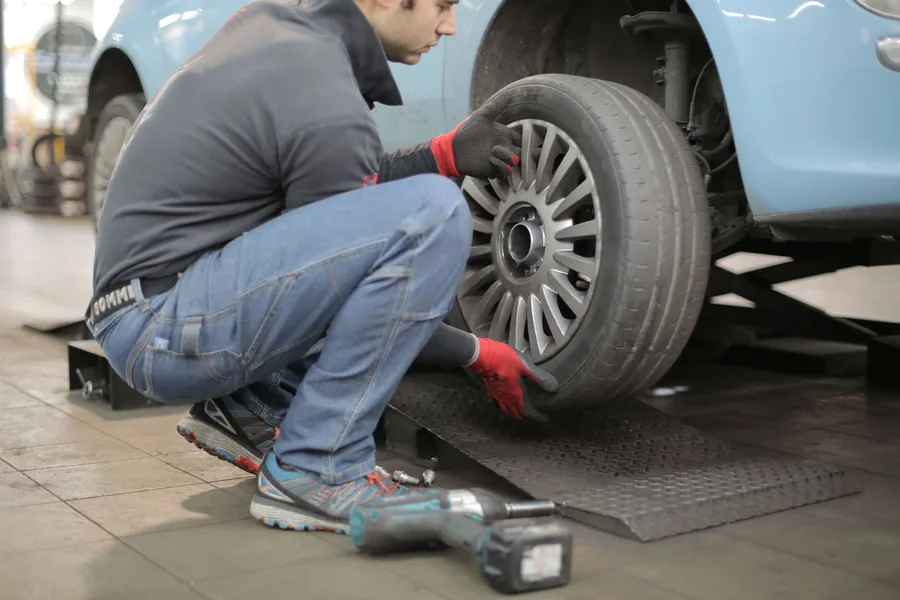
These costs scale with the car rather than the fuel it burns, and they rarely arrive on schedule. Four tyres are the largest single planned outlay for most owners; oil services, brake pads, timing belts and air-conditioning repairs arrive just as unpredictably. Our database holds certified consumption and CO₂ figures, not workshop invoices, so we cannot put a defensible Belgian number on this line.
What we can say is that maintenance is where a cheap-to-run claim most often fails. A used car needing a timing belt, four tyres and a set of brakes in one year hands back everything its lower consumption saved. Ask for the service history, the date of the last tyre change and the mileage since the last major service.
Depreciation: the biggest line of all
Depreciation dwarfs every other figure here for a car bought new. A typical new car loses roughly 15–25% of its value in the first year and about 50% over five years. On a €30,000 car that is €15,000 gone — more than five years of average petrol energy, verkeersbelasting and inspections combined.
Depreciation is also where the electric-versus-petrol decision usually gets settled. Electric cars win the energy comparison comfortably, but purchase prices are higher and residual values less predictable, so the five-year cost depends on what the car is worth at the end rather than on what it costs to charge.
The 15–25% and 50% figures describe approximate market behaviour, not a guarantee for any model. Model it for your car with the depreciation calculator.
Five-year cost of ownership on a €30,000 car
Stack the verified lines together for a €30,000 car driven 15,000 km a year for five years. Energy at the petrol average is €12,055; at the diesel average, €9,665. Verkeersbelasting at about €270 a year is €1,350, inspections at about €46 are €230, and depreciation of roughly 50% is €15,000.
That gives €28,635 for the petrol car and €26,245 for the diesel, before insurance, tyres, servicing, repairs and parking — none of which we can price from verified Belgian data. Depreciation alone is €15,000 of it, while the entire five-year petrol-versus-diesel energy gap is €2,390. Chasing the cheaper fuel is a small lever next to choosing a car that holds its value.
| Cost line (5 years, 15,000 km/yr) | Petrol | Diesel | Basis |
|---|---|---|---|
| Energy | €12,055 | €9,665 | Our model on VCA consumption data |
| Depreciation (~50%) | €15,000 | €15,000 | Approximate market behaviour |
| Verkeersbelasting | €1,350 | €1,350 | ~€270/yr typical, regional |
| Keuring | €230 | €230 | ~€46, Flanders tariff |
| Insurance, tyres, servicing, parking | not priced | not priced | No verified Belgian average |
| Total of priced lines | €28,635 | €26,245 | Arithmetic on the lines above |
How to cut your Belgian car bill
The levers that move a Belgian car budget run in order of size: what you buy, how long you keep it, what it burns, and what you pay to insure it. Energy is the fourth-largest line on a new car, so optimising fuel while ignoring depreciation is the classic mistake.
- Choose efficiency over size: the average petrol car uses 8.53 L/100km, the cheapest superminis under 4.0 — more than half the fuel bill.
- Check the diesel maths: a diesel must use no more than 85.4% of a petrol car's litres before its 17.1% premium is covered.
- Price your region's verkeersbelasting before you register: the tariff is regional and indexed each 1 July.
- Get insurance quotes before buying — the premium can easily exceed the fuel difference between two models.
- Compare total cost, not fuel cost: depreciation is roughly half a new car's value in five years.
Put your own mileage, pump price and premium into the car ownership cost calculator for a five-year total rather than an average.
Use the free calculators
Frequently asked questions
How much does it cost to own a car in Belgium in 2026?
Energy alone averages €2,411 a year for petrol, €1,933 for diesel, €1,720 for a hybrid and €917 for an electric car at 15,000 km. Add about €270 of verkeersbelasting and €46 of inspection. Insurance, tyres, servicing and parking vary too much for one figure, and depreciation is usually the largest line of all.
Why is diesel more expensive than petrol in Belgium?
Belgian diesel averages €2.208 a litre against €1.885 for petrol, a 17.1% premium, and both sit above the EU averages of €1.966 and €1.840 (European Commission Oil Bulletin, 31 August 2026). Diesel still costs less per kilometre in our data because diesel engines use 31.5% fewer litres, but only if the car clears that premium.
Is an electric car cheaper to run in Belgium?
On energy, clearly yes. The 182 electric records we hold average 17.46 kWh/100km — €917 a year at Belgium's €0.35/kWh household rate, against €2,411 for the average petrol car. The cheapest, a Mini Aceman at 10.9 kWh/100km, costs €572. Public fast charging costs more, and higher purchase prices mean depreciation usually decides the five-year winner.
How much is verkeersbelasting in Belgium?
About €270 a year for a typical car, but the tax is regional: Flanders, Wallonia and Brussels each set their own tariff and indexation, so the same car can be taxed differently depending on where it is registered. Cars registered since 2016 are assessed on CO₂, fuel type and Euro standard, and rates are indexed each 1 July.
How much does the keuring or contrôle technique cost?
The standard periodic inspection is about €46 in Flanders. The fee is only part of the bill, because inspection centres are independent of repair shops: a failed test means a re-inspection fee plus repairs before the car is road legal again. Worn tyres, brakes and suspension are the usual causes of failure.
Does 15,000 km a year match my driving?
If you drive more or less, scale the figures linearly. At 7,500 km the average petrol car costs about €1,206 a year in energy and at 30,000 km about €4,822. A diesel averages €966 and €3,866 at the same distances, an electric car about €459 and €1,834.
What do these cost figures leave out?
They price energy, verkeersbelasting, the keuring and depreciation only. Insurance, tyres, servicing, repairs, parking and finance interest are excluded because we hold no verified Belgian average, and public rapid-charging tariffs vary by network. Use the car ownership cost calculator to add your own insurance quote and mileage.