12 practical ways to cut your car running costs


Running costs creep up on you: nobody notices a tank of fuel here and a service there until the annual total lands. Most of that total is controllable, and the biggest levers are not the ones people usually pull.
We costed 17,270 official UK type-approval records at current prices to work out where the money really goes, then ranked twelve changes by what they are worth.
How we measured running costs for this guide
Every figure here comes from official type-approval data in our UK Vehicle Certification Agency database: 17,270 rows across the current VCA list and two archive files. We costed each row at £1.64 per litre for petrol, £1.86 for diesel and £0.263 per kWh for household electricity, at 12,000 miles a year. Annual cost is litres per 100 km times the distance in km (1 mile = 1.609344 km) times the price; electric cars use kWh per 100 km in the same formula. Hybrid rows are always priced on petrol.
After cleaning, 17,130 rows are usable: 9,201 petrol, 6,855 diesel, 490 hybrid, 402 plug-in hybrid and 182 electric. This is an energy-cost index, not a total cost of ownership, and where the database has no data we say so rather than guessing.
Constants used throughout: petrol £1.64/L, diesel £1.86/L, household electricity £0.263/kWh, 12,000 miles a year, MOT £54.85 cap, VED reference £190 a year for the 111–130 g/km band.
What we excluded, and why it matters
We dropped 140 of the 17,270 rows — 0.8% of the source data. Of those, 129 are plug-in hybrids in the current VCA list with no consumption figure in the source at all: Volvo accounts for 21, Mercedes-Benz 18, BMW 13 and Audi 11. We did not invent a figure for them, and we did not price them on petrol as if the battery did not exist.
Nine rows fell outside our 2.5 to 25 litres per 100 km band: a 2022 Mazda CX-60 petrol at 141.2, a 2007 Kia Sorento diesel at 35.8, a 2026 Toyota Land Cruiser hybrid at 26.2, and six plug-in hybrids — Chevrolet Volt, Toyota Prius, Vauxhall Ampera, Volvo V60, Hyundai Ioniq and Kia Niro — at 1.1 to 2.1. Two more, the 2018 Range Rover and Range Rover Sport tagged as hybrids at 2.8 L/100km, went as plug-in mis-tags. Official plug-in figures assume a full battery on every journey, which is why nothing here ranks on them.
Every one of the 140 exclusions is printed with its reason in our working data, not quietly averaged away.
Where the money goes: a £6,809 a year gap
Before changing how you drive, look at what the car itself costs to move. The petrol comparison is the widest in the data: the 2000 Honda Insight at 3.4 L/100km costs £1,077 a year in fuel, while the Lamborghini Diablo rows at 24.9 L/100km cost £7,886 — £6,809 more, or 7.3 times as much, for the same 12,000 miles. A 2026 McLaren GT at 23.7 L/100km still costs £7,506.
Diesel, hybrid and electric show the same pattern over a smaller range, so choosing within a powertrain is worth thousands and choosing the wrong powertrain for your mileage is worth hundreds.
| Powertrain | Thriftiest | Annual cost | Thirstiest | Annual cost | Gap a year |
|---|---|---|---|---|---|
| Petrol | 2000 Honda Insight, 3.4 L/100km | £1,077 | 2001 Lamborghini Diablo, 24.9 L/100km | £7,886 | £6,809 |
| Diesel | 2017 Peugeot 208, 3.0 L/100km | £1,078 | 2004 Volkswagen Touareg, 12.2 L/100km | £4,382 | £3,305 |
| Hybrid | 2018 Toyota Prius, 3.0 L/100km | £950 | 2026 Mercedes-Benz G-Class, 14.7 L/100km | £4,656 | £3,706 |
| Electric | 2026 Mini Aceman, 10.9 kWh/100km | £554 | 2026 Mercedes-Benz G-Class, 30.3 kWh/100km | £1,539 | £985 |
The twelve ways to reduce running costs, ranked
The list runs from the largest levers to the smallest: the first four are about the car you choose, because that is where the biggest numbers live. The rest are about how you run it.
- Buy the car with the lowest certified consumption you can live with.
- Match the powertrain to your annual mileage, not to the badge.
- Charge at home if you can — electric is the cheapest energy per mile.
- Treat official plug-in hybrid figures as laboratory results.
- Bank every 1 L/100km improvement: £317 a year at 12,000 miles.
- Cut the miles you actually drive; the bill scales with distance.
- Pay less per litre where it is worth your time.
- Keep tyre pressures correct and replace tyres before they are illegal.
- Take the roof rack, box or bike carrier off when it is not in use.
- Service on schedule and fix small faults before they become big ones.
- Buy at two to three years old, where depreciation has already happened.
- Compare insurance at renewal and check the fixed charges.
1. Buy the lowest-consumption car you can live with
This is the single biggest decision in the article. The cheapest petrol cars in the UK data are small, light and unglamorous, and the gap between them and an average petrol car is £1,624 a year — the difference between the dataset petrol mean of £2,701 and the thriftiest row at £1,077.
Small city cars dominate because they combine low weight, small frontal area and modest power. The Suzuki Celerio at 3.6 L/100km costs £1,140 a year, and the Citroën C1, Kia Niro, Peugeot 108 and Fiat 500 at 3.8 L/100km cost £1,204. The trade-off is real: small boots, four seats, modest motorway refinement. But owning one instead of a mid-range petrol car frees up more than £1,000 a year, every year you keep it.
| Make | Model | Year | Consumption | CO₂ | Annual fuel |
|---|---|---|---|---|---|
| Honda | Insight (2000 YM) | 2000 | 3.4 L/100km | 80 g/km | £1,077 |
| Suzuki | Celerio | 2017 | 3.6 L/100km | 84 g/km | £1,140 |
| Citroën | C1 | 2016 | 3.8 L/100km | 88 g/km | £1,204 |
| Kia | Niro | 2018 | 3.8 L/100km | 88 g/km | £1,204 |
| Peugeot | 108 | 2014 | 3.8 L/100km | 88 g/km | £1,204 |
| Fiat | 500 & 500C | 2018 | 3.8 L/100km | 90 g/km | £1,204 |
| Hyundai | i10 | 2017 | 4.0 L/100km | 93 g/km | £1,267 |
| Škoda | Citigo | 2016 | 4.1 L/100km | 95 g/km | £1,299 |
2. Match the powertrain to your mileage, not the badge
The group averages across the whole cleaned dataset answer the petrol-or-diesel question better than any pair of models, because they cover old cars and new ones together. Diesel is only about 13% dearer per litre than petrol at current prices (1.86 against 1.64), so its efficiency advantage still shows — but the cheapest diesel, a 2017 Peugeot 208 at 3.0 L/100km and £1,078, is level with the cheapest small petrol.
Mileage decides the rest. Diesel pays on long, steady motorway runs, hybrids pay in town where the battery recovers braking energy, and electric pays hardest per mile if you can charge overnight. At low annual mileage the cheapest petrol car beats every powertrain argument on cost alone.
| Powertrain | Rows | Mean consumption | Mean cost | Median cost |
|---|---|---|---|---|
| Petrol | 9,201 | 8.53 L/100km | £2,701 | £2,470 |
| Diesel | 6,855 | 5.84 L/100km | £2,096 | £1,976 |
| Hybrid | 490 | 6.08 L/100km | £1,927 | £1,853 |
| Electric | 182 | 17.46 kWh/100km | £887 | £858 |
3. Charge at home if you can: electric is cheapest per mile
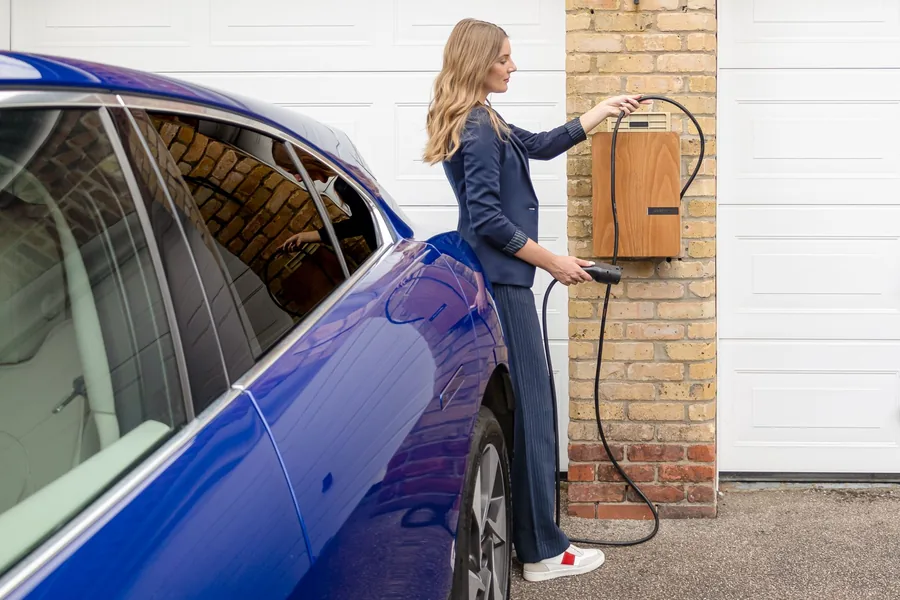
The 182 electric rows are the cheapest group by a clear margin. The 2026 Mini Aceman needs 10.9 kWh/100km and costs £554 a year in household electricity — around half the £1,140 of the best small petrol car. The mean electric car costs £887, which is £1,814 less than the petrol mean of £2,701.
Home charging is what makes that work: electricity at £0.263 per kWh is far cheaper per unit than petrol at £1.64 a litre, and a motor converts more of it into motion. If you cannot charge at home you buy public electricity instead, and the database holds no public charging prices, so the arithmetic changes entirely.
| Make | Model | Year | Consumption | Annual cost |
|---|---|---|---|---|
| Mini | Aceman | 2026 | 10.9 kWh/100km | £554 |
| Mercedes-Benz | CLA Saloon | 2026 | 12.2 kWh/100km | £620 |
| Dacia | Spring | 2026 | 12.5 kWh/100km | £635 |
| Fiat | 500 | 2025 | 13.3 kWh/100km | £676 |
| Tesla | Model 3 | 2026 | 13.8 kWh/100km | £701 |
| Volkswagen | ID.7 | 2026 | 14.2 kWh/100km | £721 |
4. Treat plug-in hybrid figures as laboratory results
Plug-in hybrids are the one group we could not cost honestly, and that is the lesson. All 129 plug-in rows in the current VCA list carry no consumption figure at all, and the older plug-in rows that do sit between 1.1 and 2.1 L/100km — numbers that assume a fully charged battery at the start of every journey and a driver who stays inside the electric range.
Real use rarely looks like that. Once the battery is flat the car is a heavy petrol car with a small engine. If you can charge daily and your journeys fit the electric range, a plug-in can be very cheap; if you cannot, buy a normal hybrid or an efficient petrol car and judge it on figures that do not depend on a full battery.
5. Bank every 1 L/100km improvement: £317 a year
This is the most useful number here for day-to-day decisions, because it turns a consumption figure into money. Improving a petrol car by 1 litre per 100 km saves £317 a year at 12,000 miles; the same gain on a diesel saves £359, because diesel costs more per litre; on an electric car 1 kWh/100km is worth £50.79.
It also shows what is not worth doing. Moving an 8.5 L/100km petrol car to 7.5 L/100km is worth £317; moving it to a thriftiest-in-class 4 L/100km car is worth about £1,400. Better driving might be worth one or two of those steps — choosing the right car is worth six of them.
| Improvement | 8,000 miles | 12,000 miles | 20,000 miles |
|---|---|---|---|
| 1 L/100km better — petrol at £1.64/L | £211 | £317 | £528 |
| 1 L/100km better — diesel at £1.86/L | £239 | £359 | £599 |
| 1 kWh/100km better — home charging at £0.263/kWh | £33.86 | £50.79 | £84.65 |
6. Cut the miles you actually drive
Every mile not driven is fuel not bought, and the fuel bill scales linearly with distance. Cutting a typical petrol car from 12,000 to 8,000 miles a year saves £901; the same 4,000 miles off a thirstiest-in-class petrol car saves £2,628. A house move or a job change can add more to your running costs than any change of car.
If you drive 8,000 miles a year rather than 12,000, every fuel claim in this article shrinks by a third when you apply it to your own car — and grows by two thirds at 20,000 miles.
| Car | 8,000 miles | 12,000 miles | 20,000 miles |
|---|---|---|---|
| Thriftiest petrol (£1,077 at 12,000) | £718 | £1,077 | £1,795 |
| Typical petrol (mean 8.53 L/100km) | £1,800 | £2,701 | £4,501 |
| Thirstiest petrol (24.9 L/100km) | £5,258 | £7,886 | £13,144 |
7. Pay less per litre where it is worth your time
Pump price is the one line you cannot change by choosing better, so it is worth knowing what it is worth. A 10p per litre difference costs a 6 L/100km petrol car £116 a year at 12,000 miles and £193 at 20,000; on a 4 L/100km city car the same 10p is £77, and on an 8 L/100km car £154.
Note what we cannot tell you: the database holds certified consumption and CO₂ data, not forecourt prices, so we have no verified figure for the gap between supermarkets, motorway services and branded stations. Measure it locally. And do not drive ten miles out of your way to save 5p a litre — a 20-mile detour at 22.5p a mile costs £4.50.
| Car at 12,000 miles | Litres a year | Value of 10p/L | Value of 5p/L |
|---|---|---|---|
| Thrifty petrol, 4.0 L/100km | 772 L | £77 | £39 |
| Average petrol, 6.0 L/100km | 1,159 L | £116 | £58 |
| Thirsty petrol, 8.0 L/100km | 1,545 L | £154 | £77 |
8. Keep the tyres right — pressures first, then tread
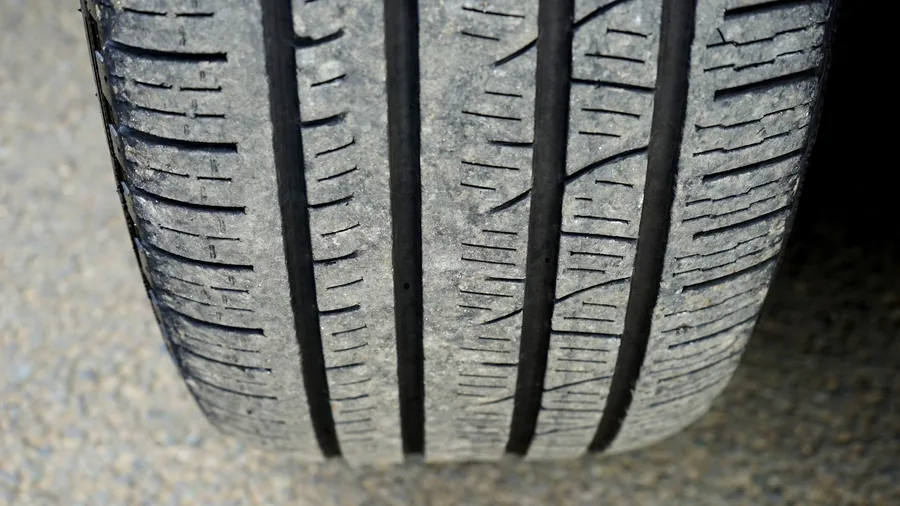
Tyres are the only part of the car that touches the road and the cheapest lever after fuel, because most of the saving comes from attention rather than spending. Check pressures monthly and before long journeys, using the handbook or door-pillar figures rather than the maximum on the sidewall, and check them cold. Under-inflated tyres raise rolling resistance, wear at the shoulders and overheat on motorways; over-inflated tyres wear the centre of the tread and reduce grip.
Tread depth is a legal matter, not a comfort one, and tyres should be replaced before they reach the limit. We give no prices here on purpose: the database holds consumption, CO₂ and specification data with no columns for tyre prices, fitting charges or labour rates, so any figure would be invented. Budget for a full set locally for the size your car takes.
The MOT is capped at £54.85, so it is identical for everyone and there is nothing to optimise.
9. Take the roof rack off when you are not using it
Anything bolted to the outside of the car changes its shape, and shape drives drag. A roof rack, box or bike carrier adds frontal area where the airflow is fastest and least smooth, so the penalty is small around town and much larger at motorway speed. Removing the rack when it is not in use is free and takes two minutes.
Weight matters less than most people assume — roof bars are a few kilograms, while the drag they create at 70 mph is the bigger effect. The same logic applies inside the car: a boot full of tools is a permanent penalty. Our database holds no aerodynamic data for any model, so we cannot quote a percentage, but the direction is not in doubt and the fix costs nothing.

10. Service on schedule and fix small faults early
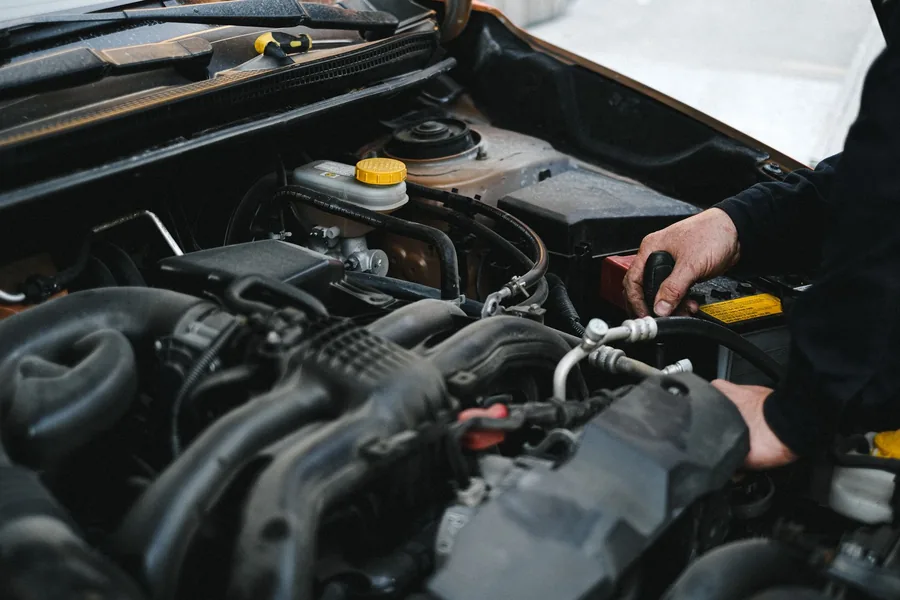
Maintenance is the part of running costs that punishes delay. A skipped service shortens the life of expensive components and can void a warranty you already paid for. Oil, filters, brake fluid and coolant all have intervals for a reason, and meeting them costs far less than a failed engine or a seized caliper. Investigate new noises, warning lights and fluid loss immediately: a worn bush becomes a suspension rebuild, and most large bills are small bills postponed.
Servicing and repair prices are not in our database at all, so treat the timing as the controllable part. What the data does show is that efficiency is worth real money — a 1 L/100km drift back up through neglect costs £317 a year on a petrol car.
11. Buy at two to three years old
Depreciation is usually the largest cost of ownership and the most invisible, because it never appears on a monthly statement. A typical new car loses roughly 15–25% of its value in year one and about 50% over five years — general market behaviour, not a figure from our database, which holds specification and consumption data but no prices or resale values.
A two or three year old car has already absorbed the steepest part of the curve, so the remaining loss is slower and flatter: the same engine, the same equipment and the same certified consumption as the new buyer paid for. Cheap cars also lose less money in cash terms than expensive ones even when the percentage loss is larger, and the longer you keep a car the more years you have to spread the depreciation you did pay.
12. Compare insurance at renewal and check the fixed charges
Insurance is the most negotiable line in the budget and the one most people renew on autopilot. There is no efficiency trick and no figure we can quote: premiums depend on you, your postcode, the car group and your claims history, and our database holds no insurance data. The same driver in the same car can be quoted very different prices by different insurers in the same week.
So do it mechanically once a year: get quotes with identical cover, vary the voluntary excess, check what is bundled in, and pay only for cover you would claim on. The other fixed charges rarely move. The MOT is capped at £54.85, identical for everyone; VED is banded by CO₂, and our only verified reference is around £190 a year for the 111–130 g/km band, so check the rate for the exact model year before buying.
Do the cheapest-to-run cars also pay less tax?
Mostly yes, which is a useful cross-check on the whole argument. In our data, 46% of the cheapest 920 petrol rows emit 110 g/km or less, against 5% of all 9,201 petrol rows; the median CO₂ of the cheap group is 113 g/km against 183 g/km overall. Take the 50 cheapest petrol rows and every one sits at or under 100 g/km, with none above 130 g/km while 85% of all petrol rows are.
Diesel and hybrid tell the same story: the cheapest diesel rows have a median of 97 g/km against 146 for the group, and the cheapest hybrid rows a median of 82 g/km against 132. The £190 VED reference applies to the 111–130 band and most of these cars sit at or below its bottom edge, but that is the only VED figure we hold, so check the lower bands yourself.
| Measure | Cheapest 920 petrol rows | All 9,201 petrol rows |
|---|---|---|
| Median CO₂ | 113 g/km | 183 g/km |
| At or under 110 g/km | 423 rows (46%) | 424 rows (5%) |
| Above 130 g/km | 1 row | 7,811 rows (85%) |
| Mean annual fuel cost | £1,507 | £2,701 |
Pence per mile: the number to remember
Cost per mile is the most portable version of everything above. At 12,000 miles a year the thriftiest petrol row costs 9.0p a mile in fuel, the average petrol car 22.5p and the thirstiest petrol row 65.7p; the average hybrid costs 16.1p and the average electric car 7.4p.
That makes fuzzy decisions concrete: a 20-mile round trip costs about £4.50 in an average petrol car and about 92p in the thriftiest electric one. Between 9.0p and 65.7p there is a factor of seven, and no amount of careful driving or cheap refuelling closes a gap that size.
| Car or group | Annual cost (12,000 miles) | Fuel cost per mile |
|---|---|---|
| Thriftiest petrol | £1,077 | 9.0p |
| Average petrol (8.53 L/100km) | £2,701 | 22.5p |
| Thirstiest petrol (24.9 L/100km) | £7,886 | 65.7p |
| Thriftiest diesel | £1,078 | 9.0p |
| Average diesel | £2,096 | 17.5p |
| Thriftiest hybrid | £950 | 7.9p |
| Average hybrid | £1,927 | 16.1p |
| Thriftiest electric | £554 | 4.6p |
| Average electric | £887 | 7.4p |
Put your own mileage and prices into it
The figures here are a ranking, not a forecast: they hold mileage, prices and efficiency constant so the comparison is honest, but your numbers will differ. Start with annual mileage, because everything scales with it, then apply your real consumption — a car returning 10–25% more than its official figure is normal — your own pump price and your actual insurance quote.
The calculators below do that arithmetic and show which line is really hurting, which is often not the one people expect.
- Car ownership cost calculator for the full annual total
- Fuel cost calculator for spend at your own mileage and pump price
- EV charging calculator to compare home and public charging
- Depreciation calculator for the largest cost with no receipt
Nothing here includes insurance, servicing, tyres, depreciation or MOT fees — the databases behind it hold none of that data, and we would rather leave a line blank than fill it with a guess.
Use the free calculators
Frequently asked questions
What is the single biggest way to reduce car running costs?
Choosing a more efficient car. Across 17,130 cleaned UK records the thriftiest petrol car costs £1,077 a year in fuel at 12,000 miles and the thirstiest £7,886, a gap of £6,809. Moving from the average petrol car at £2,701 to the thriftiest saves £1,624 a year before tax, insurance or servicing.
How much is 1 L/100km actually worth?
On petrol at £1.64 a litre it is £317 a year at 12,000 miles, £211 at 8,000 and £528 at 20,000. On diesel at £1.86 a litre it is £359 at 12,000 miles. On an electric car 1 kWh/100km is worth £50.79 a year on household electricity at £0.263 per kWh.
Is an electric car cheaper to run than petrol?
On household electricity, clearly. The average electric car in the UK data costs £887 a year at 12,000 miles against £2,701 for the average petrol car, and the thriftiest costs £554. If you cannot charge at home you buy public electricity instead, and our database holds no public charging prices.
Does driving more smoothly really save money?
It helps, but it is smaller than choosing the right car. Every 1 L/100km you improve is worth £317 a year on petrol at 12,000 miles, so smooth driving is worth a step or two of that. Replacing an average petrol car with a thriftiest-in-class one is worth about £1,624 a year.
What do these running cost figures leave out?
Everything that is not fuel or electricity. The databases hold certified consumption, CO₂ and specification data only — no insurance premiums, tyre prices, servicing bills, labour rates, MOT repairs, finance or resale values. Depreciation is usually the largest cost of ownership and is only described here in general market terms.
Should I buy a plug-in hybrid to cut running costs?
Only if you can charge it daily and rarely exceed its electric range. Official plug-in figures in our data run from 1.1 to 2.1 L/100km, and 129 current plug-in rows carry no figure at all. Once the battery is flat it is a heavy petrol car, so without a charging routine a normal hybrid is safer.