Buy vs lease vs PCP: which costs less in 2026?


Buy vs lease vs PCP comes down to one number: everything you pay from the day you take the car to the day you give it back or sell it. Monthly payment alone tells you nothing, because two deals with the same £300 a month can end £5,000 apart once running costs, end-of-term charges and what you keep at the end are counted.
This 2026 guide splits the question in two. The finance side is written as open arithmetic you complete with your own quote, because we hold no verified UK APR, residual-value or average-payment source. The running-cost side is proved from 15,312 certified UK Vehicle Certification Agency records, so you can see exactly what the cars people actually lease cost to run at 12,000 miles a year.
How this buy vs lease vs PCP comparison is built
Everything costed here comes from the UK Vehicle Certification Agency database — the official source for type-approval fuel and energy consumption and CO₂. We loaded 17,270 rows across the vca-uk, vca-mega and vca-archive datasets and costed 15,312 unique make-model-year-fuel records at the verified UK constants of £1.64 per litre petrol, £1.86 per litre diesel and £0.263 per kWh household electricity, at 12,000 miles a year. One mile is 1.609344 km, so 12,000 miles is 19,312.128 km, and annual energy cost is simply consumption per 100 km multiplied by 193.12128 and by the price of the unit.
The finance side is different in kind. That database holds no purchase prices, no residual values, no APR and no monthly-payment data, and we hold no verified UK finance-rate source either. So rather than dress up a guess, the money sections below show the arithmetic you need and leave the rate, deposit and term to you. Where a rate appears, it is labelled illustrative and is not a market claim.
Certified figures come from the VCA database. Finance figures are arithmetic on a rate you supply from your own quote.
What buying, leasing and PCP actually are
Buying outright means you own the car from day one. There is no mileage cap, no wear-and-tear standard to answer to, and no end-of-term decision. You also absorb the whole depreciation curve yourself, and depreciation is the largest single cost of running a new car for most owners.
Leasing (personal contract hire) is a rental: a deposit plus fixed monthly payments for two to four years, an agreed mileage allowance, and the car goes back at the end. PCP is a purchase agreement with a back door. You pay a deposit and monthly payments, then at the end you return the car, part-exchange it, or pay an agreed final amount to keep it.
- Buy outright: you own it, no mileage limit, full depreciation exposure
- PCP: lower payments, mileage cap, three exit choices
- All three: identical fuel, VED, MOT and insurance bills
The one equation that decides buy vs lease vs PCP
Add up five things: the deposit, the monthly payment multiplied by the number of months, the running costs over the same period, any end-of-term charge for excess mileage or condition, and whatever you keep at the end. That last term is the one people forget. On a purchase it is the car's remaining value; on a lease it is zero, because the car was never yours.
Three of those five are identical whichever route you pick. The same car burns the same fuel, carries the same road tax, needs the same MOT and attracts a similar insurance quote. Running cost is not a leasing cost or a buying cost — it is a car cost, and it is the part we can measure exactly.
- Write down the deposit and every monthly payment for the full term
- Add running costs for the same mileage: fuel, VED, MOT, servicing, insurance
- Add any excess mileage or condition charge you might realistically trigger
- Subtract what you keep: resale value on a purchase, the final amount on a PCP, nothing on a lease
- Compare the four totals, not the monthly payments
Depreciation is the cost only the buyer carries
A new car typically loses roughly 15–25% of its value in the first year and about half over five years. That is general market behaviour rather than a figure for any specific model, and it matters here because a lease or PCP is really a way of paying for part of that depreciation in monthly instalments instead of in one lump.
That is the honest trade at the centre of the comparison. Leasing converts a large, badly timed, uncertain loss into a small, predictable monthly payment. Buying keeps the loss but lets you amortise it over a much longer period, which is the only reason buying usually wins on total cost.
Buying and holding for five years or more usually wins on total cost. Leasing usually wins on monthly cash flow and predictability.
The finance side is a scale, not a pretend rate
A monthly payment is a promise about cash flow, not about cost. A £300 payment over 36 months costs £10,800. The same £300 over 48 months costs £14,400. Nothing about the car changed; the term did. This part of the calculation needs no sourced rate at all, which is why it is the safest place to start.
The table below is pure arithmetic on a payment you choose. Use your actual quoted payment, then compare routes on total paid rather than on the figure the salesperson leads with. A dealer or broker can quote you an APR in seconds; we will not invent one, so this is the scale you fill in.

| Monthly payment | 36 months | 48 months | 60 months |
|---|---|---|---|
| £250 | £9,000 | £12,000 | £15,000 |
| £300 | £10,800 | £14,400 | £18,000 |
| £350 | £12,600 | £16,800 | £21,000 |
| £400 | £14,400 | £19,200 | £24,000 |
The deposit arithmetic almost nobody runs
Deposits are where comparisons quietly go wrong. A £2,000 deposit on a £300-a-month deal over 36 months costs £2,000 plus £10,800, or £12,800 in total. Stretch the same deal to 48 months and it costs £16,400. The extra year costs £3,600 whether or not anybody calls it cheaper.
When you compare a lease quote against a PCP quote or a cash purchase, put the deposit in the same column as the payments. Then check what the deposit is actually buying: on a purchase it reduces how much you finance, while on a lease it usually buys down the monthly figure and disappears.
- Deposit plus payments, always — never the monthly figure alone
- A bigger deposit lowers the payment, not the total
- On a lease a deposit is not equity; on a purchase it feeds what you own
What an illustrative rate does to the numbers
Interest is the one part of this we cannot source. The arithmetic below uses an explicitly illustrative 7.9% rate applied as simple interest on a declining balance — interest equals the sum financed, multiplied by the rate, multiplied by the term in years, halved. It is a demonstration of how the arithmetic behaves, not a UK market rate, and no part of it should be treated as a quote.
The pattern to take away is that term length costs more than rate shopping does. At the illustrative rate, £20,000 over 36 months adds £2,370 of interest, while the same £20,000 over 48 months adds £3,160. Financing £30,000 over 48 months adds £4,740. The interest on a longer deal grows even when the headline rate is identical, because the balance stays outstanding for another year.
| Sum financed | Term | Interest at illustrative 7.9% | Total paid |
|---|---|---|---|
| £20,000 | 36 months | £2,370 | £22,370 |
| £20,000 | 48 months | £3,160 | £23,160 |
| £30,000 | 48 months | £4,740 | £34,740 |
The 7.9% figure is illustrative arithmetic only. We hold no verified UK finance-rate source — check your own quote.
The running-cost spine: certified records, not estimates
Everything from here on is provable. Cost is calculated directly from the certified combined consumption figure: litres per 100 km multiplied by the distance in hundreds of kilometres, multiplied by the pump price. Electric cars use the same formula with kWh per 100 km and the household electricity price. Hybrids are priced on petrol.
Of the 15,312 cleaned records, 2,201 have a model year of 2020 or later — 963 petrol, 506 diesel, 237 hybrid and 182 electric. That recent slice is the one that matters for this question, because lease and PCP deals are written on new or nearly-new cars. Older records stay in the wider averages, where they show how much efficiency has moved over two decades.
Constants: petrol £1.64/L and diesel £1.86/L (EU Oil Bulletin, 31 August 2026), electricity £0.263/kWh (Eurostat household, H2 2025), 12,000 miles a year.
Data quality: the 140 rows we threw out
Rankings are only as good as their cleaning. Of 17,270 loaded rows, 129 carry no usable consumption figure and cannot be costed, and 9 fall outside a sane band for a road car — above or below 2.5–25.0 L/100km, or outside 5.0–40.0 kWh/100km for electric models. The outliers are mostly plug-in hybrids showing 1–2 L/100km, plus a 2022 Mazda CX-60 petrol at 141.2 L/100km and a 2026 Toyota Land Cruiser hybrid at 26.2 L/100km, which are source artefacts rather than real fuel use.
Two more rows go for mis-tagging. The source labels some plug-in hybrids as plain hybrids, and a pair of 2018 Range Rover rows appear at 2.8 L/100km. That is a plug-in test result achieved with a full battery on every trip, not a charge-sustaining hybrid figure, so both are removed from the hybrid tables entirely. The numbers below never include them.
- 129 rows: no usable consumption measurement, dropped
- 9 rows: out of band, including a Mazda CX-60 petrol at 141.2 L/100km
- 2 rows: 2018 Range Rover hybrids at 2.8 L/100km, plug-in mis-tags
- Remaining: 15,312 certified records, 2,201 of them 2020 or later
What the cars people actually lease cost to run
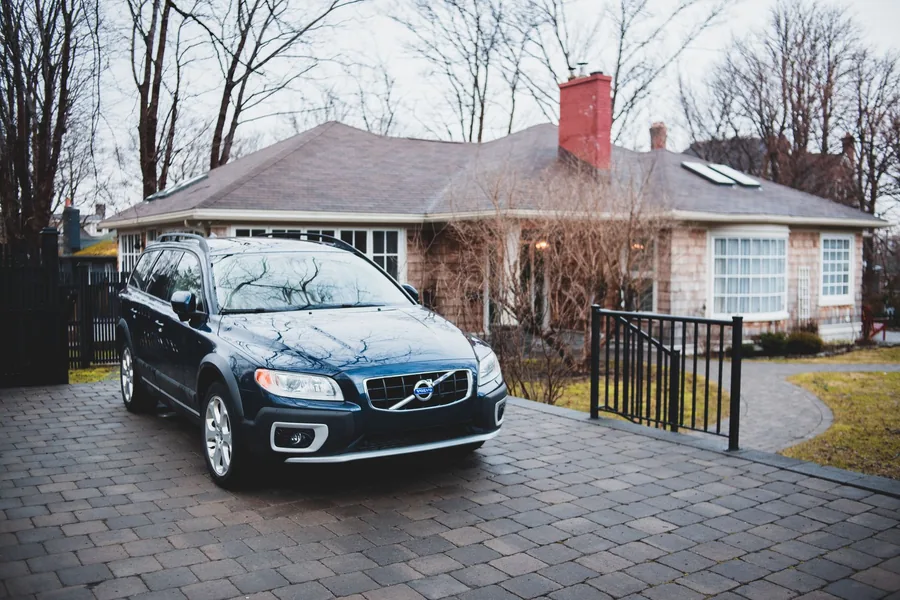
Lease and PCP deals cluster in a handful of segments: C-segment hatchbacks, compact SUVs and small saloons. Across 22 named volume models in the 2020-and-later data, the cheapest certified record for each comes out at £1,362 a year in energy at 12,000 miles, the average is £1,742, and the most expensive is £2,122. The spread between the cheapest and dearest car in that list is £760 a year.
That spread is smaller than most people expect, and it is the first genuinely useful finding. The running-cost difference between a Yaris Hybrid and a Volvo XC40 is about £63 a month. The finance difference between two deals on the same forecourt can easily be larger than that, which is why payment size dominates the average buyer's decision and total cost loses.
The table below picks the cheapest certified record for each model in that recent set, so it reads as the best case for each car rather than an average. Treat it as a floor for the running-cost column on any quote you are comparing.
| Model (as certified) | Year | Fuel | Consumption | Annual energy | 3 years |
|---|---|---|---|---|---|
| Toyota Yaris Hybrid | 2026 | Hybrid | 4.3 L/100km | £1,362 | £4,086 |
| Renault Clio | 2026 | Hybrid | 4.3 L/100km | £1,362 | £4,086 |
| Peugeot 208 | 2022 | Diesel | 3.8 L/100km | £1,365 | £4,095 |
| Vauxhall Corsa | 2026 | Hybrid | 5.1 L/100km | £1,615 | £4,846 |
| VW Tiguan | 2026 | Hybrid | 6.1 L/100km | £1,932 | £5,796 |
| BMW 3 Series Saloon | 2026 | Petrol | 6.6 L/100km | £2,090 | £6,271 |
Cheapest petrol, diesel, hybrid and electric in 2026
At the efficient end of the 2020-and-later data, the cheapest petrol car is a 2022 Honda Jazz at 4.5 L/100km and £1,425 a year, certified at 102 g/km CO₂. The cheapest diesel is a 2022 Peugeot 208 at 3.8 L/100km and £1,365, at 101 g/km. The cheapest non-plug hybrid is a 2026 Mazda2 Hybrid at 3.8 L/100km and £1,204, at 87 g/km. The cheapest electric car is a 2026 Mini Aceman at 10.9 kWh/100km and £554, which is £871 a year less than the cheapest petrol car.
Two details are worth holding onto. First, the best diesel now costs £161 a year more than the best hybrid, and the Peugeot 208 sits £161 a year above the Mazda2 Hybrid, so diesel's historic fuel advantage has been overtaken by hybrid drivetrains at these pump prices. Second, all four of these cars sit at 87–102 g/km CO₂, below the 111–130 g/km band the £190 road-tax reference applies to, so that reference figure is an upper bound for them rather than a bill.
| Class | Car | Year | Consumption | CO₂ | Annual energy |
|---|---|---|---|---|---|
| Cheapest petrol | Honda Jazz | 2022 | 4.5 L/100km | 102 g/km | £1,425 |
| Cheapest diesel | Peugeot 208 | 2022 | 3.8 L/100km | 101 g/km | £1,365 |
| Cheapest hybrid | Mazda2 Hybrid | 2026 | 3.8 L/100km | 87 g/km | £1,204 |
| Cheapest electric | Mini Aceman | 2026 | 10.9 kWh/100km | n/a | £554 |
Running cost by fuel type: the averages that matter
Averages beat cherry-picked winners when you are choosing between deals on cars you have not shortlisted yet. Across all 15,312 cleaned records the average petrol car costs £2,737 a year, the average diesel £2,130, the average hybrid £1,945 and the average electric £887. Petrol averages 8.64 L/100km, diesel 5.93, hybrids 6.14 and electric cars 17.46 kWh/100km.
Restricting to model year 2020 and later barely moves the petrol, diesel and electric averages but changes the hybrid picture, because modern hybrids are now mainstream family cars rather than compact Toyota hatchbacks. Petrol averages £2,742 a year, diesel £2,147, hybrid £2,112 and electric £887. The petrol-to-electric gap is £1,856 a year on the recent data and £1,851 on the full set — stable enough to plan around.
The ordering inside the petrol group is worth noticing too. Diesel and hybrid now sit within £35 a year of each other at these pump prices, so the old diesel-versus-petrol argument has largely been settled by drivetrain technology. The gap that still matters, and the only one large enough to change which finance deal is the cheapest, is the one between combustion and electric.
| Powertrain | Records (all) | Mean annual energy | Records 2020+ | Mean 2020+ | Gap vs petrol 2020+ |
|---|---|---|---|---|---|
| Petrol | 8,248 | £2,737 | 963 | £2,742 | — |
| Diesel | 6,046 | £2,130 | 506 | £2,147 | £595 |
| Hybrid | 443 | £1,945 | 237 | £2,112 | £630 |
| Electric | 182 | £887 | 182 | £887 | £1,856 |
The £1,856 gap that decides the comparison
Here is the finding that changes how you should read a finance quote. The average petrol car in the 2020-and-later data costs £1,856 a year more in energy than the average electric car. Spread over a 36-month agreement that is about £5,567, or £155 a month. Spread over 48 months it is £7,424, still £155 a month, because the saving scales with the miles rather than with the term.
Which means the right question is not which deal has the lower payment, but whether the payment difference is bigger than the running-cost difference. A low-running-cost car can carry a £155-a-month higher finance payment and still finish level over three years. Below that threshold, cheaper-to-run wins on total cost even when it looks more expensive every month.
Petrol £2,742 minus electric £887 is £1,856 a year, £155 a month over 36 months, £5,567 over three years. The same comparison on the full dataset is £1,851 a year.
Worked example: an electric lease costing £100 a month more
Take a petrol PCP at £300 a month over 36 months and an electric lease at £400 a month over the same term, both with no deposit and both at 12,000 miles a year. The electric deal costs £3,600 more in payments, because £100 multiplied by 36 is £3,600. The petrol car costs £5,567 more in energy over the same three years, which is the annual £1,856 gap multiplied by three.
Net result: the more expensive-looking electric deal finishes £1,967 ahead. Stretch both to 48 months and the payment premium is £4,800 against an energy saving of £7,424, so the electric deal finishes £2,624 ahead. This is why monthly-payment comparisons mislead, and it is arithmetic you can run on your own two quotes in a minute.
| Petrol PCP | Electric lease | Difference | |
|---|---|---|---|
| Monthly payment | £300 | £400 | +£100 |
| Payments over 36 months | £10,800 | £14,400 | +£3,600 |
| Energy over 36 months at 12,000 miles a year | £8,227 | £2,660 | −£5,567 |
| Three-year total, energy plus payments | £19,027 | £17,060 | −£1,967 |
Mileage is the multiplier on every number here
Running costs scale linearly with distance, which makes mileage the single biggest lever you control. At 12,000 miles a year the average petrol car spends £2,742 on energy and the average electric car £887, a gap of £1,856. Halve the mileage and the gap halves; double it and the gap doubles.
Mileage also drives the end-of-term risk. A lease or PCP written at 8,000 miles a year with a driver doing 14,000 will generate a bill at hand-back, and that bill can wipe out the entire running-cost advantage of the car you chose. Set your allowance from your actual annual mileage, not the number that makes the quote look good.
| Annual mileage | Mean petrol energy | Mean electric energy | Annual gap |
|---|---|---|---|
| 6,000 | £1,371 | £443 | £928 |
| 8,000 | £1,828 | £591 | £1,237 |
| 12,000 | £2,742 | £887 | £1,856 |
VED, MOT and servicing: the same on every route
Road tax and the MOT are the reader's responsibility whether the car is bought, leased or on PCP, and they do not change with the finance route. For context, the VED reference in the 111–130 g/km band is £190 a year and the MOT fee is capped at £54.85 for a car test. Together those come to £244.85 a year, £734.55 across a three-year agreement.
Notice how small that is next to the fuel question. Three years of road tax and two MOTs cost about £735 — barely half the annual energy gap between an average petrol car and an average electric one. Servicing and insurance are the same story: they vary with the car and the driver, not with the paperwork, and they belong in the same column when you compare two deals.
| Fixed cost | Rate | 3 years | 4 years |
|---|---|---|---|
| VED reference (111–130 g/km band) | £190/yr | £570 | £760 |
| MOT (fee cap) | £54.85 per test | £109.70 | £109.70 |
| Combined reference | £244.85/yr | £734.55 | £979.40 |
Mileage caps, excess charges and end-of-term bills
Leases and PCPs both carry an agreed annual mileage and a condition standard set by the finance company. Go over the allowance and you pay a per-mile charge at the end; return the car with kerbed alloys, dents or worn trim and you pay for refurbishment. We hold no verified UK figure for excess-mileage rates or refurbishment costs, so treat any number you see quoted elsewhere as something to check against your own agreement terms.
Buying removes those risks completely. Drive what you like, modify the car, sell it whenever you want, and the only penalty is the market value at the moment you sell. That freedom has a cash value that never appears in a comparison table, and for irregular drivers it is often worth more than the difference between two monthly payments.
No verified UK excess-mileage rate or refurbishment charge is held here. Read the mileage and condition terms in your own agreement before signing.
End of term: balloon, hand back or part-exchange
On a PCP you make a decision at the end of the term, and the three options have very different financial consequences. Paying the agreed final amount gets you the car and whatever equity sits in it. Handing it back ends the arrangement with nothing further to pay, provided the mileage and condition terms are met. Part-exchanging rolls any equity into the next car and starts the cycle again.
The size of that final amount is set at the start of the agreement and is a forecast of the car's future value, not a market figure we can verify. That is precisely why leasing and PCP comparisons should be run on your actual quoted numbers. On a lease there is no fourth option: whatever the car is worth at the end is not your concern, which is the appeal and the cost of the whole structure.
- Purchase: sell, keep, or run it into the ground — the residual is yours
- PCP: pay the final amount, hand back, or part-exchange
- Lease: hand back within the agreed terms, or extend
- Every route: the same fuel, VED, MOT, servicing and insurance
When buying wins and when leasing wins
Buying wins when you keep cars for five years or more, when your mileage is irregular or high, when you want to modify the car or sell it early, and when you can fund it without expensive borrowing. The longer you hold, the more of the depreciation curve you get for your money, and the running cost of a well-chosen car keeps accruing to you rather than to a finance company.
Leasing and PCP win when cash flow is the constraint, when you want a new car under warranty every few years, and when you drive consistent mileage inside the allowance. They also win when the car you choose is cheap to run, because the running-cost saving keeps working for you whatever the payment structure. Choose the efficient car first, then argue about the paperwork.
- Buy: five-year-plus ownership, high or unpredictable mileage
- PCP: predictable mileage, lower monthly budget, option to own
- Lease: lowest monthly budget, always want a new car
- Any route: the running cost is set by the car, so choose that first
Run your own numbers before you sign
The data in this guide tells you what any given car will cost to run at 12,000 miles a year at today's UK prices, and it tells you that the petrol-to-electric gap is worth around £155 a month over a typical term. What it cannot tell you is the payment, deposit and final amount on the specific deal in front of you, because we hold no verified source for those.
So do this: get two or three real quotes, put the deposit and every payment into one total, add the running cost for the car from the certified figures, then compare. The calculators below do the arithmetic in your browser, and the depreciation calculator keeps the ownership side honest when you are weighing up a purchase.
- Get buy, lease and PCP quotes for the same car, noting the deposit and every payment
- Add three or four years of running cost at your mileage using the certified consumption figures
- Add the end-of-term exposure you might realistically hit: excess mileage and condition charges
- Subtract what you keep at the end on the purchase or PCP route, and nothing on the lease
- Pick the lowest total, not the lowest monthly payment
The finance side is arithmetic on your own quote. The running-cost side is certified UK VCA data at fixed UK prices and 12,000 miles a year.
Use the free calculators
Frequently asked questions
Is it cheaper to buy or lease a car in the long run?
Buying usually wins over five years or more because you carry the depreciation once, then keep the benefit. Leasing always costs in total because the depreciation is paid repeatedly on a series of new cars. Our certified data does not change that: it just shows the running-cost part is identical on both routes.
What is a balloon payment in PCP?
It is the agreed final amount you can pay to keep the car at the end of a PCP. The figure is set when you sign and is a forecast of the car's future value, not a market price. We hold no verified UK residual-value source, so compare the figure you are quoted against a real used price.
Can I go over the mileage limit on a PCP or lease?
Yes, but you pay an excess-mileage charge at the end, quoted in pence per mile in your agreement. We hold no verified UK rate for those charges, so check your own terms. If you regularly exceed the allowance, buying avoids the penalty entirely because there is no mileage cap.
How much does running cost differ between an electric car and a petrol car?
Across 2020-and-later certified records the average petrol car costs £2,742 a year in energy at 12,000 miles and the average electric car £887, a gap of £1,856 a year or about £155 a month over a 36-month agreement. At £1.64/L petrol and £0.263/kWh, that difference is structural.
Do I still pay VED and MOT if I lease a car?
Yes. Road tax and the MOT are the driver's responsibility on every finance route. For reference, VED in the 111–130 g/km band is £190 a year and the MOT fee is capped at £54.85, so three years of both is about £735. Servicing and insurance are also unchanged by the finance agreement.
Why does this guide not give monthly payment examples?
Because the database behind it holds certified consumption and CO₂ only, not prices, residual values or APRs, and we hold no verified UK finance-rate source. Rather than publish invented payments, the guide shows the arithmetic and leaves the rate, deposit and term to your own quote.