Car Insurance Costs Across Europe and North America in 2026
The car insurance average cost changes by more than half depending on which country you ask, and by about a third depending on which number you look at inside a single country. This page puts the premium published by each country's own central bank, regulator or insurance-industry association next to a running cost we can compute ourselves from official vehicle records, so the two sides of the bill sit in the same sentence.
Cover is the one big motoring cost no calculator can work out for you. Fuel follows a certified consumption figure and a pump price. A test fee is published. Road tax follows a CO2 band or a vehicle weight. Insurance follows your age, your history, your postcode, your excess and the repair cost of the car you happen to own, and every insurer prices that differently. So we do the honest version: source the average premium, say exactly what it measures and which year it covers, and then show how large that premium is next to the costs that can be computed exactly.
Why the average car insurance cost is so hard to pin down
Search for the car insurance average cost and every page gives you a different number. That is not only sloppy research. Three different quantities travel under that name. Average expenditure per insured vehicle divides total written premium by the car-years of liability cover in force. A combined average premium adds the liability, collision and comprehensive averages together, so it describes a policy carrying all three. Average premium actually paid divides premium by the policies sold. In the United States in 2023 the first two differed by $156.68 a year — $1,281.92 against $1,438.60 — from the same official dataset.
A second distortion is the year. A regulator publishes the year it has finished auditing, not the year you are living in. The American figures below describe 2023, the Irish ones 2024, the British ones the first quarter of 2026. Mixing them into one table without dates is how a national average becomes a fiction.
So each figure on this page is attributed to the body that collects the underlying data, with its year and a plain description of what it measures. Where no comparable national average exists, we say that instead of presenting a comparison site's headline as though a regulator had published it.
A national average is what everybody paid. It is not a quote for you, and no insurer will charge you it.
What the average car insurance cost is in eight countries
Read the table with the years attached and the spread is still enormous: the American driver pays more than double the French driver, and the Dutch average is higher again. Read it without the years and it tells you nothing, because the British number is a paid average from this year while the American one is a written-premium statistic from a report published in 2025 about the 2023 calendar year.
One more trap sits inside the French figure. France Assureurs publishes its average excluding insurance premium tax, which every other figure in the table includes. The French position at the top of the ranking is therefore flattered, and the real gap to the Netherlands is narrower than the raw numbers suggest.
| Market | Published average | Year | Published by, and what it measures |
|---|---|---|---|
| France | 511 EUR | 2025 | France Assureurs — average premium, first-category car, single contract, excluding tax |
| Sweden | 6,581 kr | latest survey | Compricer — average car insurance premium |
| Ireland | 623 EUR | 2024 | Central Bank of Ireland — average written premium per private motor policy |
| United Kingdom | 560 GBP | Q1 2026 | Association of British Insurers — average premium actually paid |
| Finland | 685 EUR | latest comparison | Taloustaito — average of 40 published quotes, traffic plus kasko |
| Canada | 1,330.50 CAD | 2024 | GISA — average earned premium per insured vehicle (median of six provinces) |
| United States | 1,281.92 USD | 2023 | NAIC — average expenditure per insured vehicle, all three covers |
| Netherlands | 1,292.64 EUR | H1 2026 | Geld.nl premium monitor — average across all cover levels |
Which country is cheapest for car insurance? The eight ranked in euros
Ranking pounds against kronor is meaningless, so every premium in this section is converted to euros at the European Central Bank reference rate of 9 September 2026. On that basis France is the cheapest country for car insurance of the eight, and the Netherlands is the most expensive, at roughly two and a half times the French figure.
- France — 511 EUR, the average on a single-contract policy and excluding tax
- Sweden — 6,581 kr, about 590 EUR
- Ireland — 623 EUR
- United Kingdom — 560 GBP, about 652 EUR
- Finland — 685 EUR, averaged across 40 published quotes
- Canada — 1,330.50 CAD, about 829 EUR, and a median of six provincial averages rather than a national one
- United States — 1,281.92 USD, about 1,100 EUR
- Netherlands — 1,292.64 EUR
The gap between first and last is 782 EUR a year. The ranking is of published averages, not of what a given driver would be quoted in each country.
What we can price exactly: a year of running costs from 48,700 official records
The other half of the comparison is the part nobody has to estimate. Our vehicle database holds about 48,700 official records: American EPA data for model years 2000 to 2026, Canadian NRCan data back to 1995, and three UK type-approval sets covering current models plus the 2000 to 2022 archive. For each market we take the datasets we serve that market from, de-duplicate to one entry per make, model, year and powertrain, keep the most efficient variant of each, and price the certified consumption at that market's verified fuel or electricity price.
Distance is fixed at 15,000 km a year, or 12,000 miles in the United States and the United Kingdom, where pumps are sold in gallons. Test fees are annualised, so Ireland's NCT at 55 EUR every second year enters as 27.50 EUR. American and Canadian records carry no annual test or road-tax figure in our data, so those rows are energy only.
One caution before the table: the American and Canadian pools include pickups, vans and large SUVs, which is why their median consumption sits at 12.6 L/100km against 7.9 L/100km in the European pools. That is a difference between car markets, not a difference in efficiency. Compare each country with itself.
| Market | Median consumption | Median annual energy | Plus test and road tax |
|---|---|---|---|
| Ireland | 7.9 L/100km | 2,180 EUR | 238 EUR |
| United Kingdom | 7.9 L/100km | 2,502 GBP | 245 GBP |
| United States | 12.6 L/100km | 2,629 USD | none in our data |
| Canada | 12.6 L/100km | 3,308 CAD | none in our data |
| Germany | 7.9 L/100km | 2,650 EUR | 340 EUR |
| France | 7.9 L/100km | 2,457 EUR | 78 EUR |
| Spain | 7.9 L/100km | 2,054 EUR | 105 EUR |
| Netherlands | 7.9 L/100km | 2,785 EUR | 765 EUR |
| Finland | 7.9 L/100km | 2,611 EUR | 245 EUR |
| Sweden | 7.9 L/100km | 19,434 kr | 1,700 kr |
| Belgium | 7.9 L/100km | 2,234 EUR | 316 EUR |
Insurance as a share of what a car actually costs to run
Add the premium to a year of energy, the test and the road tax and you get the one number most owners never assemble: what the car costs before depreciation. Doing that for the eight markets with a published premium puts insurance at between 17% and 33% of the total, and it changes the story each country tells about itself.
In France and the United Kingdom the premium is the smallest of the three big lines: 17% of the running total, well behind a year of fuel. In the United States and Canada it is roughly twice that, because the premium is large in cash terms while the energy is cheaper than in Europe. The widely repeated idea that insurance is the hidden killer of motoring budgets is really an American and Canadian story, not a European one.
| Market | Premium | Year of energy | Test + tax | Running total | Insurance share |
|---|---|---|---|---|---|
| United States | 1,282 USD | 2,629 USD | none | 3,911 USD | 33% |
| Canada | 1,330.50 CAD | 3,308 CAD | none | 4,638 CAD | 29% |
| Netherlands | 1,293 EUR | 2,785 EUR | 765 EUR | 4,842 EUR | 27% |
| Sweden | 6,581 kr | 19,434 kr | 1,700 kr | 27,715 kr | 24% |
| Ireland | 623 EUR | 2,180 EUR | 238 EUR | 3,041 EUR | 20% |
| Finland | 685 EUR | 2,611 EUR | 245 EUR | 3,541 EUR | 19% |
| United Kingdom | 560 GBP | 2,502 GBP | 245 GBP | 3,307 GBP | 17% |
| France | 511 EUR | 2,457 EUR | 78 EUR | 3,046 EUR | 17% |
Deliberately excluded from every figure on this page: depreciation, servicing, tyres and repairs. None of them can be computed from a certified record, and none are insurance.
In the United States, insurance is a third of the running cost
The NAIC figure is an expenditure statistic: total liability, collision and comprehensive premium written in a state divided by its liability car-years. Nationally it came to $1,281.92 per insured vehicle in 2023, up nearly 14% on 2022. The state averages behind it run from $807.77 in North Dakota to $1,864.63 in Florida, a factor of 2.3 between two jurisdictions with the same federal framework.
The data year lags, and costs kept moving after it. The American consumer price index for motor vehicle insurance rose 49.9% between the 2019 average and July 2026, and household spending on vehicle insurance went from $1,775 to $1,993 per consumer unit, a 12.3% increase that the Bureau of Labor Statistics flagged as statistically significant. The NAIC itself warns that its own state comparisons should be treated with caution, because the figures average away coverage limits, deductibles and what people drive.

In Canada the province decides, not the make of the car
Canada has no official national average, because each province runs its own system and publishes its own measure. The provinces that report the same statistic through their statistical agent GISA give a clean four-year comparison for 2024: Ontario 1,928 CAD, Alberta 1,702 CAD, Nova Scotia 1,302 CAD, Newfoundland and Labrador 1,359 CAD, New Brunswick 1,208 CAD and Prince Edward Island 1,018 CAD. Ontario is 89% above Prince Edward Island for the same measure, in the same country, in the same year.
The most recent official figures move further. Ontario's regulator FSRA reported an average premium of 2,164 CAD for the 12 months to October 2025. Alberta's rate board reported 1,903 CAD for 2025. British Columbia's public insurer ICBC reported 1,358 CAD for basic plus optional cover in 2024/25. Quebec's published figure of 1,067 CAD covers property damage only, because bodily injury there is funded separately through a contribution inside the registration renewal. Statistics Canada records auto premiums up 36.4% between December 2014 and December 2024.
Britain: the average premium fell while repair bills rose
The Association of British Insurers runs the only tracker based on what customers actually pay rather than what they are quoted, across roughly 28 million policies a year. It put the average British motor premium at 560 GBP in the first quarter of 2026. That was one pound more than the final quarter of 2025 and twenty pounds below the same quarter a year earlier. The third quarter of 2025 stood at 551 GBP, so the trend through 2025 and into 2026 was broadly flat after several years of sharp increases.
Repair costs tell the opposite story. British insurers paid 2.9 billion GBP in motor claims in the first quarter of 2026, of which 1.9 billion GBP went on vehicle repairs, up 3% in a single quarter. The average accidental damage claim rose 8% in the same period to 3,699 GBP. Premiums have been held down while the underlying cost of putting a damaged car right keeps climbing, which is why the British average looks reassuring and the industry does not.
Ireland: premiums up 9% to 623 EUR a year
The Central Bank of Ireland collects the premium data directly from insurers, so the Irish figure is a written premium rather than a quoted one: 623 EUR per private motor policy in 2024, up 9% on 568 EUR in 2023. Total private motor premium income was 1.46 billion EUR across the market.
Set against our Irish running cost the premium is 20% of the total, because Irish energy costs are high in their own right: a median car consumes 7.9 litres per 100 km, which at 1.84 EUR a litre over 15,000 km is 2,180 EUR a year. Add the 27.50 EUR annualised NCT (55 EUR every two years) and 210 EUR of motor tax and the car costs 3,041 EUR before a single repair or tyre.
France: the cheapest of the eight, on a figure that excludes tax
France Assureurs, the French insurance federation, publishes the average premium for a first-category private car insured on a single contract: 511 EUR in 2025, excluding tax, up 6.5% on 2024. Total motor insurance premiums reached 30.2 billion EUR, up 7.5%, and the branch's combined ratio was 101.2%, meaning French motor insurers paid out slightly more than they collected.
That is the number at the top of our ranking, with the tax caveat attached. French running costs are also mid-table: 2,457 EUR of energy a year, a contrôle technique at about 78 EUR, and no annual road tax for private cars at all, so the 511 EUR premium accounts for 17% of the running total. Britain lands on the same share from a higher premium and lower fuel prices.
The Netherlands: 107.72 EUR a month and a 37 EUR gap between provinces
Dutch comparison service Geld.nl runs a premium monitor on sixty fixed scenarios rather than on whatever its visitors happen to quote, which makes it the most consistent Dutch series available even though it is not a regulator's statistic. It put the average premium at 107.72 EUR a month in the first half of 2026, or 1,292.64 EUR a year, with the cheapest comparable quote at 70.41 EUR a month and the dearest at 159.79 EUR — a difference of 89.38 EUR a month between the best and worst offer for the same driver.
Cover level matters less than postcode. Over the same period a third-party policy averaged 109.57 EUR a month, limited cover 100.17 EUR and all-risk 111.49 EUR, spreads of a few euros. Provincial averages differ by far more: Zuid-Holland came in at 119.60 EUR a month and Friesland at 82.54 EUR. The Dutch statistics agency's index for motor insurance premiums rose 10.5% in 2025, and the Dutch running cost in our table is the highest of the eleven markets once the heavy MRB road tax is counted.
Sweden and Finland: the Nordic picture
Sweden's Compricer survey puts the average car insurance premium at 6,581 kr, up 5.3% from 6,247 kr the year before. In euros that is roughly 590, which makes Sweden the second cheapest of our eight — a result that surprises people who assume Nordic motoring is uniformly expensive. Swedish energy costs are high in kronor (19,434 kr a year at our median consumption) but the premium still only accounts for 24% of the running total.
Finland's published evidence comes as quotes rather than a national mean: one consumer comparison priced traffic insurance plus kasko for ten common cars at four insurers, giving 40 published figures from 504 EUR to 1,086 EUR for the same cover types on different models. Averaged, that is 685 EUR. The mandatory traffic insurance alone, the liikennevakuutus that every car must carry, typically costs 150 to 500 EUR depending on the car, the driver and the bonus level.
Germany, Spain and Belgium: why we will not print an average
Germany does not have a single national premium and the German Insurance Association, the GDV, does not publish one. It prices roughly 32,000 vehicle types across more than 400 registration districts, so a national average would be an artefact of the weighting rather than a number anyone pays. What the GDV does publish is the claim side: the average third-party property-damage claim for a car came to about 4,250 EUR in 2024, up 7% in a year. German running costs in our data are 2,650 EUR of energy plus 340 EUR of test and road tax.
Spain's market is dominated by terceros cover, the cheap third-party product, and the industry association UNESPA publishes claims and market statistics rather than an average premium — so no comparable figure exists and we are not going to dress a comparison site's headline up as one. Belgium does publish ranges: a Belgian broker comparison puts third-party cover at 300 to 550 EUR a year, mini-omnium at 500 to 950 EUR and full omnium at 1,000 to 1,800 EUR, with the non-life premium tax having moved from 9.25% to 9.6% and premiums up around 4 to 5% in 2026.
Your postcode moves the price more than your car does
The clearest pattern in every country's data is that insurers price the place, not the badge. Ontario's regulator splits its own average into a Greater Toronto Area figure of 2,810 CAD and a rural figure of 1,740 CAD, so the same measure moves by about 60% purely with the postal code. In the Netherlands the provincial spread is 119.60 EUR a month in Zuid-Holland against 82.54 EUR in Friesland, a difference of 45%. Germany avoids a national average altogether because the GDV needs more than 400 registration districts to describe its own market.
That is why two neighbours with identical cars and identical driving records can pay very different premiums, and why a national average is useful context rather than a benchmark for your own bill. It also explains the shape of the country ranking above: dense, expensive-to-repair, litigation-heavy markets price high, and markets where the state carries part of the injury bill price low.
The same premium covers more of an electric car's year
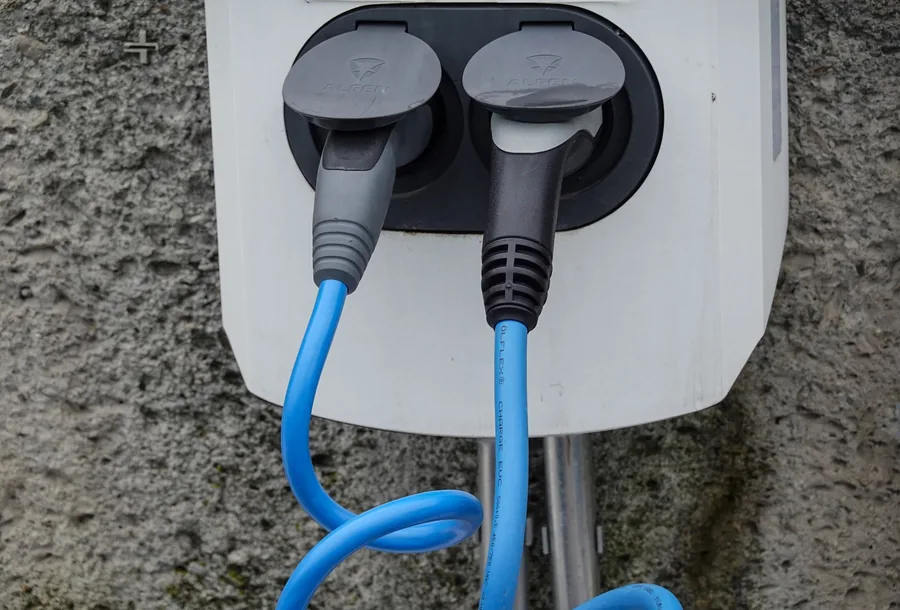
Charging a median electric car at home costs far less than fuelling a median petrol car, which quietly promotes insurance to the largest single line in the running budget. Our median electric car uses 16.9 kWh per 100 km in the European pools and 22.0 kWh in the American and Canadian pools, which at household electricity prices works out at 963 EUR a year in Ireland, 858 GBP in the United Kingdom, 761 USD in the United States, 649 EUR in France, 649 EUR in the Netherlands, 570 EUR in Finland, 558 CAD in Canada and 7,656 kr in Sweden.
Hold the premium still and the share it takes of the running total rises sharply, because the energy side of the fraction has halved. In the United States the average premium covers 63% of a year of driving an electric car, and in Canada 70%. Nobody should read that as electric cars being more expensive to insure — we have no premium data broken down by powertrain, and we are not going to invent one. It means that for an electric car, the quote you get matters more to your annual budget than the price of electricity does.
| Market | Premium | Electricity for the year | Insurance share, electric | Share, petrol |
|---|---|---|---|---|
| United States | 1,282 USD | 761 USD | 63% | 33% |
| Canada | 1,330.50 CAD | 558 CAD | 70% | 29% |
| Netherlands | 1,293 EUR | 649 EUR | 48% | 27% |
| Finland | 685 EUR | 570 EUR | 46% | 19% |
| France | 511 EUR | 649 EUR | 41% | 17% |
| Sweden | 6,581 kr | 7,656 kr | 41% | 24% |
| Ireland | 623 EUR | 963 EUR | 34% | 20% |
| United Kingdom | 560 GBP | 858 GBP | 34% | 17% |
What actually moves your premium
Almost nothing in the national averages is about the car. Insurers price the driver's age and claims history, how many years of no-claims discount have been built up, where the car sleeps at night, the annual mileage, the excess, the level of cover and the cost of repairing that specific model. The Dutch monitor is a useful illustration of how little cover level changes things: across sixty identical scenarios, all-risk cover averaged only about two euros a month more than basic third-party in the first half of 2026, while the best and worst quote for the same scenario differed by 89.38 EUR a month.
That last number is the practical lesson. In every market where a body publishes both a low and a high figure for the same driver, the spread between the cheapest and dearest offer dwarfs the difference between countries, between cover levels and between car models. Renewing without comparing is the most expensive habit in this article. So are the boring ones: an accident or a conviction on the record, a young driver added to the policy, or a car left on the street rather than in a garage.

What our calculators do and do not include
Our running-cost tools add up the parts that can be computed from official records: certified consumption priced at your market's pump or electricity rate, the periodic test, and the annual road tax where one exists. They exclude insurance, depreciation, servicing, tyres and repairs on purpose. We would rather show a smaller number we can defend than a bigger one we invented.
That is also why the table in this article keeps the premium in a separate column instead of quietly folding an average into everybody's total. Averages make bad budgets. Take your own renewal notice, add it to a running cost computed for the car you actually drive and the distance you actually cover, and you have a figure worth planning around.
- Car ownership cost calculator — fuel, test, tax and all-in annual cost for your market
- Fuel cost calculator — what your mileage costs at today's pump prices
- Car comparison calculator — two cars, same distance, same prices
- Trip cost calculator — a single journey, door to door
The bottom line on the average car insurance cost by country
The pattern across eight countries is consistent once the years and the measures are pinned down: cover costs the most in cash terms in the United States and the Netherlands, the least in France and Sweden, and it matters most where energy is cheap and least where energy is expensive.
- Cheapest of the eight for car insurance: France at 511 EUR a year, then Sweden at about 590 EUR and Ireland at 623 EUR.
- Dearest of the eight: the Netherlands at 1,292.64 EUR, then the United States at about 1,100 EUR and Canada at about 829 EUR.
- Insurance as a share of running cost ranges from 17% in France and the United Kingdom to 33% in the United States.
- For an electric car the same premium takes 34% to 70% of the running total, because the energy side halves.
- Postcode or province changes the price more than the car does: about 60% across Ontario, 45% across the Netherlands.
- No national average exists for Germany, Spain or Belgium, and the honest answer there is a range or nothing.
Use the free calculators
Frequently asked questions
What is the average car insurance cost?
It depends on which measure you use. On the figures each country's own body publishes: 511 EUR a year in France (excluding tax, 2025), 560 GBP in the United Kingdom (first quarter of 2026), 623 EUR in Ireland (2024), 685 EUR in Finland (average of 40 published quotes), 1,281.92 USD in the United States (2023) and 1,292.64 EUR in the Netherlands (first half of 2026). Always check the year and the definition before comparing two averages.
Which country is cheapest for car insurance?
Of the eight countries with a comparable published average, France is cheapest at 511 EUR a year, followed by Sweden at about 590 EUR and Ireland at 623 EUR. The Netherlands is the most expensive of the eight at 1,292.64 EUR. The French figure excludes insurance premium tax, which the others include, so the real gap is narrower than the raw ranking suggests.
Is car insurance more expensive in the United States than in Europe?
In cash terms, yes. The NAIC national average was 1,281.92 USD per insured vehicle in 2023, roughly 1,100 EUR, against 511 EUR in France, 560 GBP in Britain, 623 EUR in Ireland and 685 EUR in Finland. As a share of what a car costs to run the gap is similar but the cause is mixed: American fuel is cheap, so the same premium is a far larger slice of the annual total.
How much of a car's running cost is car insurance?
Adding the average premium to a year of energy, the test and the annual road tax puts cover at 33% in the United States, 29% in Canada, 27% in the Netherlands, 24% in Sweden, 20% in Ireland, 19% in Finland and 17% in both France and the United Kingdom. Those totals exclude depreciation, servicing, tyres and repairs.
Why does car insurance cost more in some countries than others?
The published data points at repair costs, litigation, population density, medical costs and how much of an injury bill the state carries. British insurers paid 2.9 billion GBP of motor claims in one quarter, 1.9 billion GBP of it repairs, with the average accidental damage claim at 3,699 GBP. The GDV puts the average German third-party property claim at about 4,250 EUR in 2024. Where the state funds injury compensation, premiums are lower.
Does an electric car cost less to insure?
We have no premium data broken down by powertrain, so we will not claim either way. What the numbers do show is that the same average premium takes a much larger share of an electric car's running cost, because home charging costs about half what petrol costs at the pump: the share rises to 63% in the United States and 70% in Canada, against 33% and 29% for a petrol car. Your own quote, not the fuel, is the variable worth shopping.