Fuel Cost Per Kilometre: Calculate Yours Properly


Fuel cost per kilometre is the most useful number in car budgeting: it turns a pump price and a consumption figure into one rate you can multiply by any distance. This guide calculates it from 17,130 official UK Vehicle Certification Agency records across petrol, diesel, hybrid and electric models, using verified UK prices of £1.64 per litre for petrol, £1.86 for diesel and £0.263 per kWh for household electricity.
You get the formula, the average cost per mile and per kilometre for each powertrain, the cheapest and dearest models in the data, a mileage table that scales everything to 8,000, 12,000 or 20,000 miles a year, and a plain account of what these figures leave out.
What fuel cost per kilometre actually measures
Cost per kilometre is the money you spend on energy to move one kilometre: litres of fuel or kilowatt-hours of electricity, multiplied by the price you pay for them. Nothing else is included — not insurance, tyres, servicing, depreciation or road tax. Because it is pure energy cost, it is the one running cost you can compare across petrol, diesel, hybrid and electric on identical terms.
That narrowness is a feature. Insurance premiums swing by hundreds of pounds between households for the same car, and servicing bills depend on dealer rates and driving style. Energy cost follows a simple mechanical relationship between certified consumption and the price per unit of energy, which makes it the most predictable slice of running costs you will ever measure.
Cost per kilometre covers energy only. Insurance, tyres, servicing, depreciation and road tax sit outside the data and vary too widely to average into one figure.
The fuel cost per kilometre formula in one line
Cost per kilometre equals consumption per 100 km, divided by 100, multiplied by the price per litre or per kWh. A car using 6.0 litres per 100 km at £1.64 per litre costs £0.0984 per kilometre, or 9.84 pence. An electric car using 16.0 kWh per 100 km at £0.263 per kWh costs £0.0421 per kilometre, or 4.21 pence.
One conversion covers distance, and it is exact: one mile is 1.609344 kilometres, so cost per mile is cost per kilometre multiplied by that factor. Every figure here uses the exact factor, never a rounded 1.6, because the error compounds across a year.

- Take the certified consumption figure — litres per 100 km, or kWh per 100 km for an electric car.
- Divide it by 100 to get litres or kWh per kilometre.
- Multiply by the price per litre or per kWh where you actually buy energy.
- Multiply by 1.609344 for cost per mile, or by your annual kilometres for an annual total.
The UK prices and constants used in this guide
Every figure here was produced with one fixed set of UK constants, so the comparison reflects efficiency rather than price shopping. Pump prices are the EU Oil Bulletin figures for the week of 31 August 2026: £1.64 per litre for petrol and £1.86 for diesel. Electricity is the Eurostat household price for band DC including taxes, £0.263 per kWh. Mileage is a flat 12,000 miles a year, the conventional UK private-car assumption.
Holding these constants fixed matters. Diesel is 13.4% more expensive per litre than petrol at these prices, so a diesel car has to be at least that much more efficient simply to break even. That single relationship explains much of why the diesel advantage has narrowed.
| Constant | Value | Source |
|---|---|---|
| Petrol | £1.64 / litre | EU Oil Bulletin, 31 Aug 2026 |
| Diesel | £1.86 / litre | EU Oil Bulletin, 31 Aug 2026 |
| Household electricity | £0.263 / kWh | Eurostat nrg_pc_204, H2 2025 |
| Mileage assumption | 12,000 miles / yr | KnowCarCost assumption |
| Mile to kilometre | 1 mile = 1.609344 km | Exact definition |
MOT at the £54.85 cap and VED of about £190 a year for the 111 to 130 g/km band are reference figures only. Neither is part of any cost per mile or per kilometre value here.
How the cost per kilometre dataset was built
We took every record with a usable consumption figure from the three UK Vehicle Certification Agency datasets: vca-uk, the current list, vca-mega for 2011 to 2022 and vca-archive for 2000 to 2013. That gave 17,141 rows carrying either a litres per 100 km or a kilowatt-hours per 100 km figure.
Each row was priced on its own powertrain constant. Petrol, hybrid and plug-in hybrid rows use the petrol price, because hybrids here burn petrol and never diesel. After screening, 17,130 rows remained. Because the archive reaches back to 2000, the averages describe more than two decades of certified British cars, which is why the petrol average is higher than a list of 2026 models alone would give.
| Dataset | Petrol | Diesel | Hybrid | Plug-in | Electric | Total |
|---|---|---|---|---|---|---|
| vca-uk | 218 | 56 | 237 | 0 | 182 | 693 |
| vca-mega | 3,885 | 3,071 | 180 | 381 | 0 | 7,517 |
| vca-archive | 5,098 | 3,728 | 73 | 21 | 0 | 8,920 |
| Total | 9,201 | 6,855 | 490 | 402 | 182 | 17,130 |
Data quality disclosure: nine implausible rows and two mis-tags
A cost per mile built on a broken consumption figure is worthless, so we excluded nine rows outside a physically plausible band of 2.5 to 25.0 L/100 km or 5.0 to 40.0 kWh/100 km. Eight are plug-in hybrids and one is a petrol car; all nine are named below.
Separately, the source tags a few plug-in hybrids as plain hybrids. Two 2018 Land Rover Range Rover rows show 2.8 L/100 km, an official plug-in figure that assumes a charged battery on every trip. We drop any hybrid-tagged row under 3.0 L/100 km, which removed exactly two records. The lowest hybrid figure that survives is 3.0 L/100 km from the Toyota Prius.
| Make | Model | Year | Consumption |
|---|---|---|---|
| Mazda | CX-60 | 2022 | 141.2 L/100km |
| Kia | Sorento 2.5 CRDi | 2007 | 35.8 L/100km |
| Toyota | Land Cruiser 2.8D | 2026 | 26.2 L/100km |
| Toyota | Prius Plug-in | 2013 | 2.1 L/100km |
| Volvo | V60 Plug-in Hybrid | 2013 | 1.8 L/100km |
| Kia | Niro | 2018 | 1.3 L/100km |
| Chevrolet | Volt | 2013 | 1.2 L/100km |
| Vauxhall | Ampera | 2013 | 1.2 L/100km |
| Hyundai | Ioniq | 2018 | 1.1 L/100km |
| Land Rover | Range Rover 18MY | 2018 | 2.8 L/100km |
| Land Rover | Range Rover Sport 18MY | 2018 | 2.8 L/100km |
Average fuel cost per kilometre by powertrain
Across the screened dataset the mean cost per kilometre is £0.1398 for petrol, £0.1085 for diesel, £0.0998 for hybrid and £0.0459 for electric. The medians are lower in every case, which tells you each category is pulled upward by a tail of heavy, powerful or older vehicles.
Hybrids beat diesel even though both burn fossil fuel, because the hybrid records are dominated by Toyota and Lexus systems certified at 3.0 to 4.0 L/100 km, while the diesel records include a long tail of large SUVs. Electric is in a different category: its mean is 67% below petrol and 58% below diesel, driven by cheap energy per unit and a drivetrain that converts over 90% of what it draws into motion.
| Powertrain | Records | Mean consumption | Mean £/km | Median £/km |
|---|---|---|---|---|
| Petrol | 9,201 | 8.53 L/100km | £0.1398 | £0.1279 |
| Diesel | 6,855 | 5.84 L/100km | £0.1085 | £0.1023 |
| Hybrid | 490 | 6.08 L/100km | £0.0998 | £0.0959 |
| Plug-in hybrid | 402 | 6.19 L/100km | £0.1015 | £0.0984 |
| Electric | 182 | 17.46 kWh/100km | £0.0459 | £0.0444 |
Average fuel cost per mile: the same data in miles
Most UK drivers think in miles, so here is the identical dataset per mile. The mean petrol car costs £0.2251 per mile, the mean diesel £0.1747, the mean hybrid £0.1606 and the mean electric car £0.0739. The medians come in at £0.2059, £0.1646, £0.1544 and £0.0715, and those median figures are the better planning numbers because they are not distorted by supercars and heavy SUVs.
Within every powertrain the mean sits above the median, by 9% for petrol and 6% for diesel. Buying an average car is therefore cheaper than the averages suggest, and it is the top of each range — performance models, big SUVs, older automatics — that drags the mean up.
| Powertrain | Mean £/mile | Median £/mile | Mean £/yr at 12,000 mi | Median £/yr |
|---|---|---|---|---|
| Petrol | £0.2251 | £0.2059 | £2,701 | £2,470 |
| Diesel | £0.1747 | £0.1646 | £2,096 | £1,976 |
| Hybrid | £0.1606 | £0.1544 | £1,927 | £1,853 |
| Plug-in hybrid | £0.1633 | £0.1584 | £1,959 | £1,901 |
| Electric | £0.0739 | £0.0715 | £887 | £858 |
The cheapest models per mile in the UK dataset
The ten cheapest records in all 17,130 rows are electric. The 2026 Mini Aceman leads at 10.9 kWh per 100 km, which is £0.0461 per mile, £0.0287 per kilometre and £554 a year at 12,000 miles. The Mercedes-Benz CLA Saloon follows at £620 a year, then the Dacia Spring at £635.
The spread from first to tenth is only £172 a year, so running cost should barely influence which electric car you choose — buy on space, range and price instead. None of these cars is exotic either: the Dacia Spring and Fiat 500 are among the cheapest new cars on sale anywhere, and the Aceman is a compact city crossover.
| Make | Model | Year | Consumption | £/mile | £/yr |
|---|---|---|---|---|---|
| Mini | Aceman | 2026 | 10.9 kWh/100km | £0.0461 | £554 |
| Mercedes-Benz | CLA Saloon | 2026 | 12.2 kWh/100km | £0.0516 | £620 |
| Dacia | Spring | 2026 | 12.5 kWh/100km | £0.0529 | £635 |
| Fiat | 500 Electric | 2025 | 13.3 kWh/100km | £0.0563 | £676 |
| Tesla | Model 3 | 2026 | 13.8 kWh/100km | £0.0584 | £701 |
| Mini | Cooper Electric | 2026 | 14.2 kWh/100km | £0.0601 | £721 |
| Peugeot | 2008 Electric | 2026 | 14.2 kWh/100km | £0.0601 | £721 |
| Tesla | Model Y | 2026 | 14.2 kWh/100km | £0.0601 | £721 |
| Volkswagen | ID.7 | 2026 | 14.2 kWh/100km | £0.0601 | £721 |
| Hyundai | Kona Electric | 2023 | 14.3 kWh/100km | £0.0605 | £726 |
The dearest models per mile: £0.66 at the top
Four Lamborghini Diablo records from 2000 and 2001 hold the top four places at 24.8 to 24.9 L/100 km, which is £0.6572 per mile, £0.4084 per kilometre and £7,886 a year. The 2026 McLaren GT, still on sale and certified at 23.7 L/100 km, costs £0.6255 per mile and £7,506 a year.
The gap between the cheapest and dearest record is £7,332 a year at 12,000 miles, 14.2 times the Mini Aceman's energy bill. Per mile the Diablo costs 61 pence more, so a 300-mile weekend trip is roughly £197 against roughly £14. The thirstiest diesel is an INEOS Grenadier at 12.2 L/100 km and £4,382 a year, and the thirstiest hybrid a Mercedes-AMG G 63 at 14.7 L/100 km and £4,656 — a hybrid badge appears on very inefficient cars too.
| Make | Model | Year | Consumption | £/mile | £/yr |
|---|---|---|---|---|---|
| Lamborghini | Diablo MY1998/1999 | 2000 | 24.9 L/100km | £0.6572 | £7,886 |
| Lamborghini | Diablo MY1997 | 2000 | 24.8 L/100km | £0.6546 | £7,855 |
| McLaren | GT | 2026 | 23.7 L/100km | £0.6255 | £7,506 |
| Maserati | MC12 | 2005 | 23.0 L/100km | £0.6070 | £7,285 |
| Mercedes-AMG | G 63 | 2026 | 14.7 L/100km | £0.3880 | £4,656 |
| INEOS | Grenadier Diesel | 2026 | 12.2 L/100km | £0.3652 | £4,382 |
| Mercedes-Benz | G 580 Electric | 2026 | 30.3 kWh/100km | £0.1282 | £1,539 |
Why electric cars lead on cost per mile
Electricity at £0.263 per kWh buys far more distance per pound than petrol at £1.64 per litre, for two compounding reasons: the price per unit of energy, and drivetrain efficiency. An electric motor turns over 90% of the energy it draws into motion at the wheels, while a combustion engine delivers roughly 30% of the energy in its fuel as useful work.
That advantage holds even at the wasteful end. The thirstiest electric record is the 2026 Mercedes-Benz G 580 at 30.3 kWh per 100 km, a 2.9-tonne luxury off-roader costing £0.1282 per mile and £1,539 a year, against £0.2251 per mile and £2,701 a year for an average petrol car. A three-tonne electric SUV still costs 43% less per mile than an average petrol car.
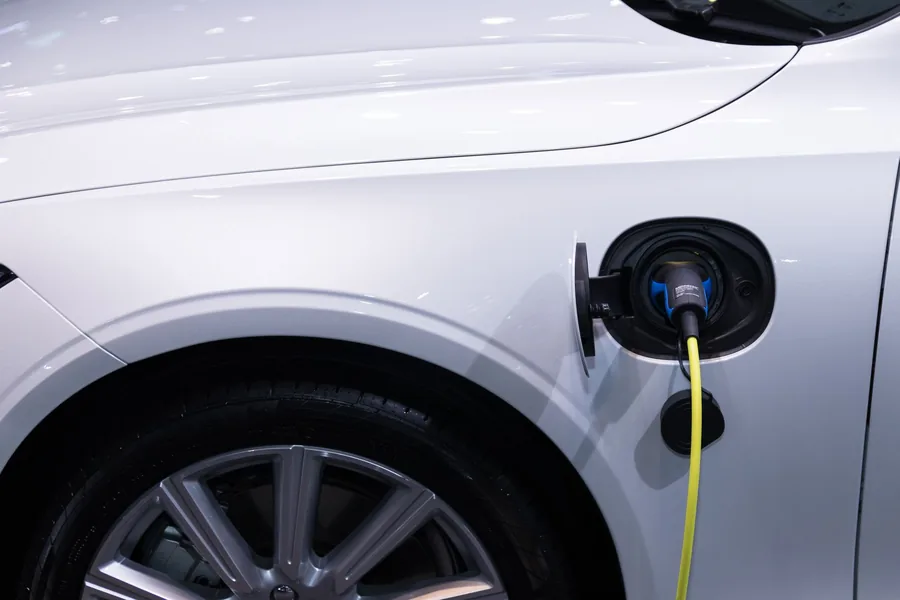
Every electric figure uses household electricity at £0.263/kWh. Public rapid charging costs more per kWh and will raise your real cost per mile.
Petrol and diesel: where the crossover sits
Diesel is 13.4% dearer per litre, so a diesel has to be at least that much more efficient to break even. It usually is, by a wider margin: the diesel mean of 5.84 L/100 km is 32% below the petrol mean of 8.53 L/100 km, leaving the mean diesel 22% cheaper per mile despite the price premium.
At the cheapest end the two fuels are level. The best diesel record is a 2016 and 2017 Peugeot 208 at 3.0 L/100 km, £0.0898 per mile and £1,078 a year; the best conventional petrol is a Suzuki Celerio at 3.6 L/100 km and £1,140, only £62 behind. A Honda Insight record from 2000 to 2004 sits at 3.4 L/100 km and £1,077, though the source tags it petrol despite Honda's early integrated motor assist — official fuel tags do not always describe the drivetrain precisely.
| Record | Powertrain | Consumption | £/mile | £/yr at 12,000 mi | CO2 |
|---|---|---|---|---|---|
| Honda Insight, 2000–2004 | Petrol | 3.4 L/100km | £0.0897 | £1,077 | 80 g/km |
| Suzuki Celerio, 2016–2017 | Petrol | 3.6 L/100km | £0.0950 | £1,140 | 84 g/km |
| Peugeot 208, 2016–2017 | Diesel | 3.0 L/100km | £0.0898 | £1,078 | 79 g/km |
| Peugeot 308, 2016–2017 | Diesel | 3.1 L/100km | £0.0928 | £1,114 | 82 g/km |
| Ford Fiesta, 2017–2018 | Diesel | 3.2 L/100km | £0.0958 | £1,149 | 82 g/km |
Hybrids: the most consistent powertrain on cost per mile
The 490 hybrid records give a mean of 6.08 L/100 km and a mean cost of £0.1606 per mile, making hybrids the cheapest fossil-fuel powertrain in the dataset. Because hybrid records are concentrated in recent years and in Toyota and Lexus systems, the average is not dragged up by two decades of older, thirstier engineering the way the petrol average is.
The best hybrid figure is 3.0 L/100 km from the Toyota Prius, at £0.0792 per mile, £0.0492 per kilometre and £950 a year, certified at 70 g/km; the Toyota Yaris Hybrid follows at 3.3 L/100 km and £1,045 a year. The real story is consistency: unlike a plug-in hybrid, the figure does not depend on your charging habits, because a self-charging hybrid has no plug.
| Make | Model | Year | Consumption | £/mile | £/km | £/yr at 12,000 mi | CO2 |
|---|---|---|---|---|---|---|---|
| Toyota | Prius | 2016–2018 | 3.0 L/100km | £0.0792 | £0.0492 | £950 | 70 g/km |
| Toyota | Yaris Hybrid | 2016–2018 | 3.3 L/100km | £0.0871 | £0.0541 | £1,045 | 75 g/km |
| Mercedes-Benz | GLS AMG 63 | 2026 | 13.3 L/100km | £0.3510 | £0.2181 | £4,212 | 300 g/km |
| Mercedes-AMG | G 63 | 2026 | 14.7 L/100km | £0.3880 | £0.2411 | £4,656 | 334 g/km |
Plug-in hybrids: why the official figure is not your figure
The 402 plug-in hybrid records that survived screening give a mean of 6.19 L/100 km and £0.1633 per mile, barely different from the 490 self-charging hybrids at £0.1606. That is worth pausing on, because plug-in hybrids are advertised with figures that look several times better than a conventional hybrid.
The official test gives a plug-in hybrid a full battery and lets it run on electricity for as much of the cycle as possible, assuming you recharge before every journey. Once the battery is flat it is a heavy petrol car carrying a battery and motor it no longer uses. We removed six plug-in rows between 1.1 and 2.1 L/100 km for exactly this reason: they describe a laboratory cycle, not a driving life. Charge nightly and stay inside the electric range and a plug-in beats the hybrid average; never plug in and it does worse than a conventional hybrid of the same size.
Plug-in hybrid records are shown separately and excluded from the hybrid averages, because their certified figure depends on charging behaviour we cannot know.
Scaling cost per mile to your own annual mileage
Cost per mile is a rate, so scaling it to your mileage is simple multiplication. At 8,000 miles a year multiply each annual figure by two thirds; at 20,000 multiply by 1.67. What changes with mileage is not the ranking but the size of the cash difference, which is why high-mileage drivers should care about cost per mile far more than low-mileage ones.
At 8,000 miles the petrol mean costs £1,800 a year and the electric mean £591. At 20,000 miles those become £4,501 and £1,478, so the electric advantage grows from £1,209 to £3,023 a year. On median figures, which exclude the most extreme vehicles, the petrol car costs £1,647 at 8,000 miles and £4,117 at 20,000, against the electric car's £572 and £1,431.

| Powertrain | 8,000 mi | 12,000 mi | 20,000 mi |
|---|---|---|---|
| Petrol | £1,800 | £2,701 | £4,501 |
| Diesel | £1,397 | £2,096 | £3,494 |
| Hybrid | £1,284 | £1,927 | £3,211 |
| Electric | £591 | £887 | £1,478 |
Converting mpg to cost per mile
If your car is quoted in miles per gallon, divide 282.481 by the mpg figure to get litres per 100 km. That constant comes from the UK gallon of 4.54609 litres and the kilometre of 1,000 metres, and it is exact. A 56.5 mpg car is 5.0 L/100 km, a 35.3 mpg car is 8.0 L/100 km, and a 23.5 mpg car is 12.0 L/100 km.
Two cautions. Older UK figures were sometimes quoted under the NEDC cycle, which flattered cars by roughly 10% to 20% against today's WLTP test, so check which cycle you have. And US gallons are 3.785 litres, so the same car is rated about 20% lower in US mpg than in UK mpg: 47 mpg UK is about 39 mpg US, and confusing the two puts your estimate out by a fifth.
| Litres / 100 km | UK mpg | Petrol £/mile | Diesel £/mile |
|---|---|---|---|
| 3.0 | 94.2 | £0.079 | £0.090 |
| 4.0 | 70.6 | £0.106 | £0.120 |
| 5.0 | 56.5 | £0.132 | £0.150 |
| 6.0 | 47.1 | £0.158 | £0.180 |
| 8.0 | 35.3 | £0.211 | £0.239 |
| 10.0 | 28.2 | £0.264 | £0.299 |
| 12.0 | 23.5 | £0.317 | £0.359 |
How to measure your own cost per mile properly
The certified figures tell you which car is cheaper; measuring your own tells you what you actually spend, and two or three fill-ups produce a number you can trust. The method below avoids the most common error, dividing a tank of fuel by the trip-meter distance without filling to the same level both times.
For an electric car the same discipline applies with kilowatt-hours: charge to the same state of charge both times, read the energy added from the charger or the car's meter rather than the battery percentage, and split the total between home and public charging, because public rapid charging can cost several times the household rate.
- Fill the tank to the pump's automatic cut-off and record the odometer reading.
- Drive normally until you are ready to refuel, covering at least 200 miles for a stable figure.
- Refuel to the automatic cut-off, ideally at the same pump, and record the litres added and the new odometer reading.
- Divide the litres by the miles covered, then multiply by the price per litre for your cost per mile.
- Repeat twice more and average, because one tank is easily distorted by a cold snap or a heavy right foot.
What cost per kilometre leaves out
This guide deliberately adds nothing to energy cost, because the other costs vary too widely to average honestly. Insurance depends on driver, postcode, declared mileage and insurance group. Tyres and servicing depend on size, brand, driving style and labour rates. Depreciation is the largest single cost for most new cars and follows the market rather than the fuel: a typical new car loses roughly 15% to 25% of its value in year one and about 50% over five years, a far bigger swing than any fuel-cost difference between comparable models.
None of this makes cost per kilometre less useful. Use it for the job it does well — energy cost per unit of distance, comparable across powertrains — and add the other costs separately from your own quotes. A precisely measured fuel figure combined with a guessed insurance figure is worse than either on its own.
- Insurance — varies by driver, postcode and insurance group
- Tyres — varies by size, brand and driving style
- Servicing and repairs — varies by schedule, labour rate and age
- Depreciation — roughly 15% to 25% in year one, about 50% over five years
- Road tax — VED reference of about £190 a year for the 111 to 130 g/km band
- Public rapid charging — costs more per kWh than the household rate used here
Choosing between petrol, diesel, hybrid and electric
Start with where you can charge, because that fact splits the decision. Households with off-street parking and a domestic supply can charge at £0.263 per kWh and should compare everything against an electric mean of £0.0739 per mile. Households without it are comparing petrol, diesel and hybrid records that all sit between £0.16 and £0.23 per mile, and the choice is far narrower.
Then look at the shape of your mileage. Stop-start urban work suits hybrids and small petrol cars, because regenerative braking recovers energy a conventional car turns into heat. Steady motorway runs narrow the hybrid advantage and suit efficient diesels. Finally, gaps inside one powertrain can exceed gaps between powertrains: the best petrol record costs £1,077 a year and the worst £7,886, while the best and worst electric records are £554 and £1,539.
The cheapest record in the dataset costs £554 a year at 12,000 miles and the dearest £7,886. That £7,332 span is wider than the gap between any two powertrain averages.
Use the free calculators
Frequently asked questions
How do I calculate fuel cost per kilometre for my own car?
Divide your consumption in litres per 100 km by 100, then multiply by the price per litre. A car using 7.0 L/100 km at £1.64 per litre costs £0.1148 per kilometre. For miles, multiply that result by 1.609344. For an electric car, use kWh per 100 km and the price per kWh instead.
What is the average fuel cost per mile for a petrol car in the UK?
Across 9,201 certified petrol records our dataset gives a mean of £0.2251 per mile and a median of £0.2059, which is £2,701 and £2,470 a year respectively at 12,000 miles. The mean sits above the median because performance cars and large SUVs pull it upward.
Is diesel still cheaper than petrol per mile?
Yes, but by much less than it used to be. The mean diesel record costs £0.1747 per mile against £0.2251 for petrol, a 22% advantage, even though diesel is 13.4% more expensive per litre at £1.86 against £1.64. At the cheapest end the two are almost level, at £1,078 against £1,140 a year.
Why do you exclude some hybrid records from the averages?
Because the source data tags some plug-in hybrids as ordinary hybrids. Two 2018 Land Rover Range Rover rows show 2.8 L/100 km, an official plug-in test figure that assumes a full battery on every trip. We drop hybrid-tagged rows below 3.0 L/100 km and show plug-in hybrids as a separate category.
Do these cost per mile figures include insurance, tyres or servicing?
No. Every figure is energy cost only, calculated from certified consumption at £1.64 per litre for petrol, £1.86 for diesel and £0.263 per kWh for electricity. Insurance, tyres, servicing, repairs, depreciation, VED and MOT sit outside the data because they vary too widely to average meaningfully.
How much does annual mileage change my fuel bill?
It scales in a straight line. The mean petrol cost is £1,800 a year at 8,000 miles, £2,701 at 12,000 and £4,501 at 20,000. The mean electric cost is £591, £887 and £1,478 over the same mileages, so the cash advantage of electric grows by more than £1,800 a year between the lowest and highest mileage.