UK car running costs 2026: the full price of ownership

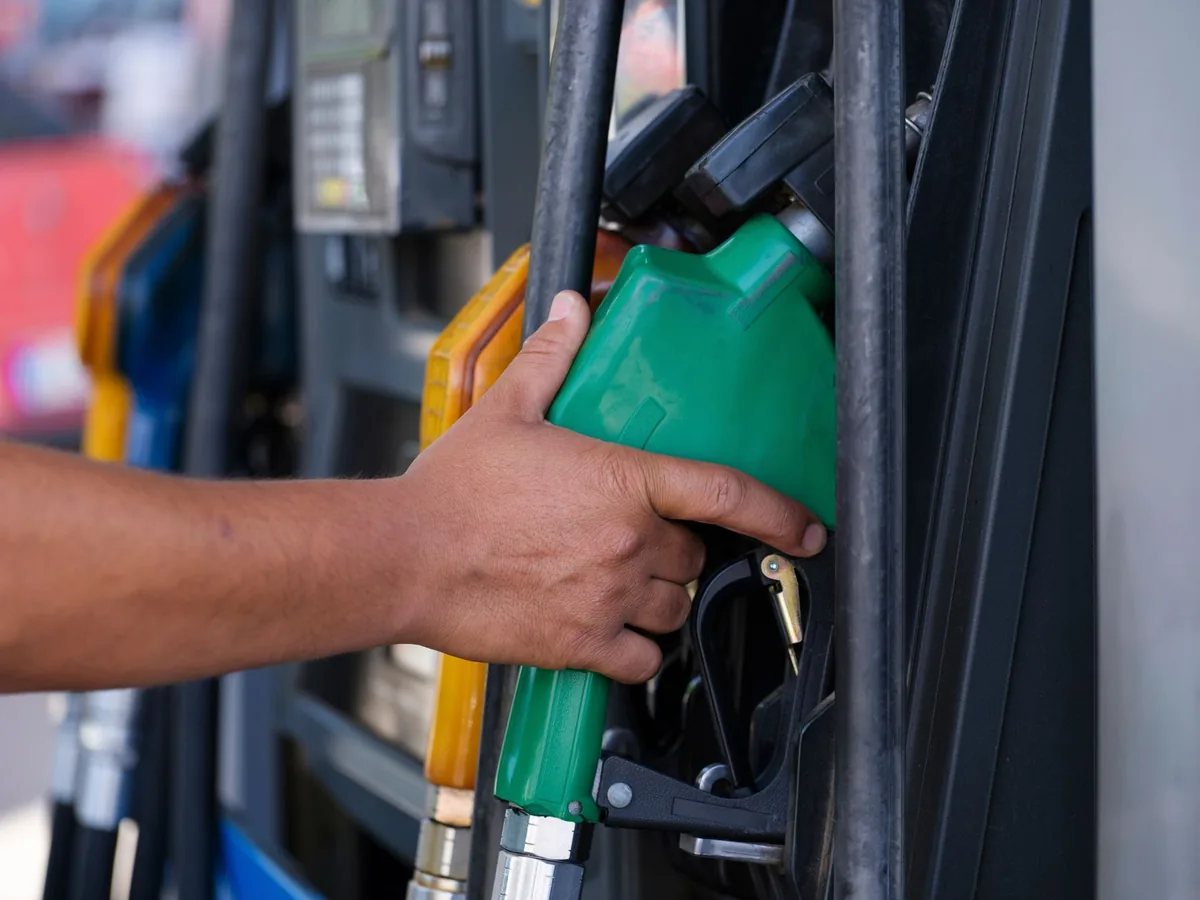
The list price on a new car is only the entry fee. UK car running costs — fuel, VED, MOT, insurance and depreciation — stack up every year you own it and often dwarf the purchase price over five or ten years.
This 2026 guide puts real numbers on that claim. We analysed 5,199 official UK Vehicle Certification Agency records covering model years 2015 to 2027, priced every one of them at verified September 2026 UK energy costs, and ranked them by what they actually cost to move 12,000 miles a year. Below you get the averages per powertrain, the cost per mile, the 15 cheapest and 15 most expensive models to run, and a total cost of ownership illustration built only from figures we can source.
What UK car running costs actually come to in 2026
Every penny you spend on a car falls into one of five buckets: depreciation (the value it loses), fuel or electricity, tax and legal costs (VED and MOT), maintenance (servicing, tyres, brakes), and finance if you borrow. Depreciation is usually the largest by far, and the only one of the five that does not appear on a receipt.
Verified UK figures for September 2026 are petrol at £1.64 per litre, diesel at £1.86 per litre, household electricity at £0.263 per kWh, VED at around £190 a year for the 111–130 g/km CO₂ band, and the MOT test capped at £54.85. Those four numbers set the floor under almost every ownership budget in the country, and they are the prices this guide is built on.
The rankings below show energy cost only — fuel or electricity at the prices above for 12,000 miles. VED and MOT appear in the breakdown but insurance, tyres, servicing, parking and depreciation do not, because they are not itemised in the official dataset.
How this UK car running cost dataset was built
The source is the UK Vehicle Certification Agency (VCA) database — the official record of type-approval fuel consumption and CO₂ for every car sold in Britain. We pulled the two current VCA datasets, filtered to model years 2015 through 2027 and to rows carrying an SI consumption figure, which returned 5,205 records. After the plausibility and test-artefact exclusions described in the next section, 5,199 rows went into the analysis: 2,543 petrol, 1,773 diesel, 352 hybrid, 349 plug-in hybrid and 182 electric.
Annual cost is calculated directly from the certified figure, with no fudge factors: litres per 100 km divided by 100, multiplied by kilometres driven, multiplied by the price per litre. Twelve thousand miles is 19,312 km. Electric models use kWh per 100 km at £0.263 per kWh; diesel rows are priced at £1.86 per litre, every other combustion row at £1.64.
| Input | Figure used | Source |
|---|---|---|
| Petrol price | £1.64 per litre | EU Oil Bulletin, week 31 August 2026 |
| Diesel price | £1.86 per litre | EU Oil Bulletin, week 31 August 2026 |
| Household electricity | £0.263 per kWh | Eurostat household prices, band DC, H2 2025 |
| Annual mileage | 12,000 miles (19,312 km) | Assumption applied to every row |
| VED reference | ~£190 per year | 111–130 g/km CO₂ band, UK |
| MOT cap | £54.85 | UK statutory maximum for a car test |
| Vehicle records | 5,199 rows | UK VCA datasets, model years 2015–2027 |
Data quality: the six rows we removed before ranking
Before publishing any ranking we clean the source. Four records fell outside our plausibility bands — L/100km outside 2.5 to 25.0, or kWh/100km outside 5.0 to 40.0 — and were excluded: a 2022 Mazda CX-60 petrol listed at 141.2 L/100km, a 2026 Toyota Land Cruiser hybrid at 26.2 L/100km, and two 2018 plug-in hybrids, a Hyundai Ioniq at 1.1 L/100km and a Kia Niro at 1.3 L/100km. The first is clearly a data-entry fault; the others are test-cycle artefacts from the older NEDC procedure that describe a laboratory sequence, not a road.
Two further rows were removed for a different reason. The VCA source tags some plug-in hybrids as ordinary hybrids, and the 2018 Land Rover Range Rover and Range Rover Sport both appear there at 2.8 L/100km with 64 g/km CO₂. That number is the official plug-in test result, achieved only with a fully charged battery on every trip. A Range Rover cannot return 2.8 L/100km on a motorway run, so both rows are excluded from the hybrid table and from the hybrid averages. Leaving them in would have dragged the hybrid average down by a figure no owner would ever see.
| Make | Model | Year | Fuel tag | Consumption | Reason for exclusion |
|---|---|---|---|---|---|
| Mazda | CX-60 | 2022 | Petrol | 141.2 L/100km | Above 25.0 L/100km band — source error |
| Toyota | Land Cruiser | 2026 | Hybrid | 26.2 L/100km | Above 25.0 L/100km band |
| Hyundai | Ioniq | 2018 | Plug-in hybrid | 1.1 L/100km | Below 2.5 L/100km band — NEDC artefact |
| Kia | Niro | 2018 | Plug-in hybrid | 1.3 L/100km | Below 2.5 L/100km band — NEDC artefact |
| Land Rover | Range Rover | 2018 | Hybrid (plug-in) | 2.8 L/100km | Plug-in test figure, not real-world |
| Land Rover | Range Rover Sport | 2018 | Hybrid (plug-in) | 2.8 L/100km | Plug-in test figure, not real-world |
Annual energy cost by powertrain: petrol, diesel, hybrid and electric
Across 5,199 records at 12,000 miles a year, the average petrol car costs £2,439 in fuel, the average diesel £1,835, the average non-plug hybrid £1,975 and the average electric car £887. The plug-in hybrid average is £2,034, but for the reason above those 349 rows are shown for reference only and are excluded from the hybrid column.
Averages hide the shape of the market, which is why the median matters just as much. The median petrol car costs £2,122 a year, £317 less than the mean, because a small number of supercars and large SUVs drag the average up. The same pattern appears in every powertrain: the median diesel is £1,724 against a £1,835 average, the median hybrid £1,869 against £1,975, and the median electric £858 against £887.
| Powertrain | Rows | Average consumption | Average annual energy | Median annual energy | Average per mile |
|---|---|---|---|---|---|
| Petrol | 2,543 | 7.70 L/100km | £2,439 | £2,122 | £0.203 |
| Diesel | 1,773 | 5.11 L/100km | £1,835 | £1,724 | £0.153 |
| Hybrid | 352 | 6.24 L/100km | £1,975 | £1,869 | £0.165 |
| Electric | 182 | 17.46 kWh/100km | £887 | £858 | £0.074 |
| Plug-in hybrid (reference only) | 349 | 6.42 L/100km | £2,034 | £1,932 | £0.169 |
Cost per mile: the number that scales to your own driving
Cost per mile is the most portable figure in this guide, because you can multiply it by your own annual mileage instead of accepting our 12,000-mile assumption. At £1.64 and £1.86 per litre and £0.263 per kWh, the average petrol car costs £0.203 per mile in fuel, the average diesel £0.153, the average hybrid £0.165 and the average electric car £0.074.
Scaling is close to linear. The cheapest petrol car in the dataset costs £570 a year at 6,000 miles, £1,140 at 12,000 and £1,900 at 20,000; an average electric car costs £443, £887 and £1,478 at the same mileages.
| Annual mileage | Cheapest petrol model | Average petrol car | Average electric car |
|---|---|---|---|
| 6,000 miles | £570 | £1,220 | £443 |
| 8,000 miles | £760 | £1,626 | £591 |
| 12,000 miles | £1,140 | £2,439 | £887 |
| 20,000 miles | £1,900 | £4,066 | £1,478 |
The 15 cheapest models to run in the UK for 2026
Ranking every certified row by annual energy cost and deduplicating so each make and model appears once produces a striking result: all fifteen cheapest cars to run in the UK are electric. The 2026 Mini Aceman E leads at 10.9 kWh/100km and £554 a year, followed by the Mercedes-Benz CLA Saloon 250+ at £620 and the Dacia Spring at £635. The table is tight — from £554 to £752 across the whole top fifteen — and it is dominated by compact cars with small frontal areas, efficient heat-pump thermal management and batteries sized for economy rather than maximum range.
The cheapest combustion car anywhere in the dataset is a long way behind. The 2018 Toyota Prius hybrid costs £950 a year and the 2017 Suzuki Celerio petrol £1,140, so the cheapest electric car saves £396 over the cheapest hybrid and £586 over the cheapest petrol. Among diesel models the 2017 Peugeot 208 leads at £1,078.
| # | Make | Model | Year | Powertrain | Consumption | Annual energy | Per mile |
|---|---|---|---|---|---|---|---|
| 1 | Mini | Aceman | 2026 | Electric | 10.9 kWh/100km | £554 | £0.046 |
| 2 | Mercedes-Benz | CLA Saloon | 2026 | Electric | 12.2 kWh/100km | £620 | £0.052 |
| 3 | Dacia | Spring | 2026 | Electric | 12.5 kWh/100km | £635 | £0.053 |
| 4 | Fiat | 500 Electric | 2025 | Electric | 13.3 kWh/100km | £676 | £0.056 |
| 5 | Tesla | Model 3 | 2026 | Electric | 13.8 kWh/100km | £701 | £0.058 |
| 6 | Mini | Cooper Electric | 2026 | Electric | 14.2 kWh/100km | £721 | £0.060 |
| 7 | Peugeot | 2008 Electric | 2026 | Electric | 14.2 kWh/100km | £721 | £0.060 |
| 8 | Tesla | Model Y | 2026 | Electric | 14.2 kWh/100km | £721 | £0.060 |
| 9 | Volkswagen | ID.7 | 2026 | Electric | 14.2 kWh/100km | £721 | £0.060 |
| 10 | Hyundai | Kona Electric | 2023 | Electric | 14.3 kWh/100km | £726 | £0.061 |
| 11 | Mercedes-Benz | CLA Saloon (MY2027) | 2026 | Electric | 14.5 kWh/100km | £736 | £0.061 |
| 12 | Volkswagen | ID.7 Tourer | 2026 | Electric | 14.6 kWh/100km | £742 | £0.062 |
| 13 | Lexus | RZ 350e | 2026 | Electric | 14.7 kWh/100km | £747 | £0.062 |
| 14 | Volkswagen | New ID.7 | 2026 | Electric | 14.7 kWh/100km | £747 | £0.062 |
| 15 | Lexus | ES 350e | 2026 | Electric | 14.8 kWh/100km | £752 | £0.063 |
The 15 most expensive models to run in the UK for 2026
At the other end of the same dataset, the 2026 McLaren GT consumes 23.7 L/100km and costs £7,506 a year in petrol at 12,000 miles — £0.626 per mile, and 13.6 times the cheapest car in the set. The 2022 Ferrari 812 follows at £6,398, the Ferrari Monza at £5,954, then a run of Rolls-Royce models — Phantom, Wraith, Ghost, Dawn and Cullinan — all between £5,448 and £5,923. All fifteen rows here are petrol V8s, V12s and W16s; no diesel or hybrid model reaches this end of the table. The thirstiest diesel in the dataset is the 2026 Ineos Grenadier at 12.2 L/100km and £4,382 a year, well below the petrol supercar tier.
One caveat on this table. The 2021 Mercedes-Benz G-Class row pairs 16.6 L/100km with a CO₂ figure of 77 g/km, which is internally inconsistent — a car cannot burn 16.6 litres per 100 km and emit 77 g/km. We report the consumption figure because it sits in line with the other G-Class years, but treat that particular CO₂ value as a source error.

| # | Make | Model | Year | Consumption | CO₂ | Annual fuel |
|---|---|---|---|---|---|---|
| 1 | McLaren | GT | 2026 | 23.7 L/100km | 270 g/km | £7,506 |
| 2 | Ferrari | 812 | 2022 | 20.2 L/100km | 373 g/km | £6,398 |
| 3 | Ferrari | Monza | 2022 | 18.8 L/100km | 366 g/km | £5,954 |
| 4 | Rolls-Royce | Phantom | 2026 | 18.7 L/100km | 351 g/km | £5,923 |
| 5 | Rolls-Royce | Wraith | 2026 | 18.0 L/100km | 357 g/km | £5,701 |
| 6 | Rolls-Royce | Ghost | 2026 | 17.9 L/100km | 359 g/km | £5,669 |
| 7 | Ferrari | GTC4 | 2022 | 17.7 L/100km | 366 g/km | £5,606 |
| 8 | Rolls-Royce | Dawn | 2026 | 17.4 L/100km | 370 g/km | £5,511 |
| 9 | Rolls-Royce | Cullinan | 2026 | 17.2 L/100km | 373 g/km | £5,448 |
| 10 | Mercedes-Benz | G-Class | 2021 | 16.6 L/100km | 77 g/km (flagged) | £5,258 |
| 11 | Bentley | Mulsanne (MY19) | 2020 | 16.6 L/100km | 365 g/km | £5,258 |
| 12 | Bentley | Mulsanne (MY20) | 2020 | 16.6 L/100km | 365 g/km | £5,258 |
| 13 | Jeep | Grand Cherokee | 2019 | 16.6 L/100km | 382 g/km | £5,258 |
| 14 | Chevrolet | Corvette Z06 | 2026 | 16.5 L/100km | 377 g/km | £5,226 |
| 15 | Bentley | Continental (MY2017) | 2018 | 15.7 L/100km | 358 g/km | £4,972 |
Why electric cars dominate the cheapest end of the market
The electric advantage is not a subsidy story and it is not a tax story — it is an efficiency story. What the certified data shows is that the average electric car uses 17.46 kWh/100km and costs £887 a year, while the average petrol car uses 7.70 L/100km and costs £2,439: a 64% lower energy bill for the same 12,000 miles. An electric motor also turns a far larger share of the energy it draws into motion than a petrol engine does. Together those two effects make the per-mile gap structural — £0.074 against £0.203 for the average car in each group.
The compression matters as much as the level. Across the 182 electric rows the annual cost runs from £554 to £1,539, while petrol spans £1,140 to £7,506. The most expensive electric car in the dataset — the 2026 Mercedes-Benz G-Class G 580 at 30.3 kWh/100km — still costs £1,539 a year in electricity, £900 less than the average petrol car.
Petrol running costs: the baseline most drivers actually pay
Petrol is the largest group in the analysis at 2,543 rows, and therefore the fairest baseline. The average petrol car is certified at 7.70 L/100km and costs £2,439 a year in fuel, with a median of £2,122. The cheapest petrol row in the entire UK dataset is the 2017 Suzuki Celerio at 3.6 L/100km — £1,140 a year, £1,299 less than the average petrol car.
The petrol table is polarised. Small naturally aspirated city cars sit between 3.6 and 4.2 L/100km, family hatchbacks and crossovers cluster between 5 and 7 L/100km, and the heavy end — large SUVs and performance models — runs from 10 L/100km upward. Because petrol is the default fuel, the pump price is also the number that decides most budgets: at £1.64 a litre, a 50-litre fill costs £82 before you move an inch.
Diesel running costs: cheaper per mile, but by less than you think
Diesel still wins on pure efficiency. The 1,773 diesel rows average 5.11 L/100km, which is 34% less fuel per 100 km than the petrol average of 7.70. The annual bill is £1,835 on average and £1,724 at the median, so the average diesel saves £604 a year against the average petrol — about 25%, meaning the diesel fuel advantage has been partly eaten by the pump price rather than the engine.
The reason is £1.86 per litre against £1.64, a 13% diesel premium. The 2017 Peugeot 208 is the cheapest diesel in the dataset at 3.0 L/100km and £1,078 a year, only £62 less than the cheapest petrol, the Suzuki Celerio.
Hybrid running costs: the Prius effect and Toyota's lead
The 352 non-plug hybrids in the dataset average 6.24 L/100km and £1,975 a year, or £0.165 per mile — cheaper than petrol and dearer than diesel per mile, largely because so many hybrids sold in Britain are large SUVs rather than compact hatchbacks. The 2018 Toyota Prius is the exception and the benchmark: 3.0 L/100km, £950 a year, 70 g/km. It is the cheapest combustion car in the entire dataset, beating the best diesel by £128 a year.
Toyota's engineering shows in the raw counts too. By make, the hybrid rows break down as Lexus 54, Mercedes-Benz 38, Toyota 37, Audi 25, BMW 20, Volvo 20, Hyundai 15 and Kia 13 — Lexus and Toyota between them account for a quarter of every hybrid record in the UK source. The Yaris Hybrid follows the Prius at 3.3 L/100km and £1,045, with the Hyundai Ioniq at 3.4 L/100km and £1,077.
Plug-in hybrids: why 349 rows sit outside the hybrid average
Plug-in hybrids are the most misread cars in the UK market. They are tested with a full battery and the engine off for as much of the cycle as the software allows, so the official combined figure lands between 1 and 3 L/100km. In our cleaned set the 349 plug-in rows average 6.42 L/100km and £2,034 a year — which is worse than the non-plug hybrid average — because most of those rows are large, heavy saloons and SUVs that are inefficient once the battery is depleted.
That is exactly why we kept plug-in hybrids out of the hybrid average, and why we removed the two Range Rover rows at 2.8 L/100km. A plug-in hybrid is only as cheap as its certified figure if you charge it before almost every journey and rarely exceed its electric range. Driven that way, the best plug-in rows in the data — the 2018 Renault Scenic and Grand Scenic at 3.5 L/100km and £1,109 a year — can beat a non-plug hybrid. Driven on the engine alone, they revert to being heavy petrol cars. Treat every plug-in figure as a best case, not a forecast.
VED in 2026: what the £190 reference band means for your bill
Vehicle Excise Duty is a CO₂-banded annual tax, and the band most new petrol and diesel cars fall into is 111–130 g/km, charged at around £190 a year. It is a reference figure here rather than a line in the energy tables, and it applies across the board — 1,127 of the 5,011 rows that carry a CO₂ value sit inside that band, 22% of the total. The cleanest tenth of the dataset, 488 rows at 100 g/km or under, falls into cheaper bands,.
Check the band of the exact model year rather than the model name — a facelift or a new engine can move a car between bands. The first-year rate on a new car is also not the rate you pay from year two, so treat the £190 as a reference for 111–130 g/km rather than a promise for your car.
- 111–130 g/km — around £190 a year, the reference band used in this guide
- 100 g/km or under — 488 of the 5,011 rows with a CO₂ figure, cheaper bands
- Zero-tailpipe-CO₂ electric cars — no CO₂ band, different rules apply
- Check the exact model year: the same nameplate can change band after a facelift
The £190 VED reference is not added to the energy totals in the tables above. It appears in the total cost of ownership illustration further down.
MOT, servicing and the costs that are not in the data
The MOT test is capped at £54.85 and is required every year once a car turns three. It covers lights, brakes, tyres, structure, seatbelts, doors, mirrors and emissions. A failure means fixing the fault and paying for a re-test, and the repair itself is where the money goes — the test fee is the smallest part of the transaction.
Servicing, tyres, brakes and unexpected repairs are the costs the official VCA dataset cannot tell you anything about, because they depend on age, mileage, parts prices and dealer labour rates rather than certified efficiency. A city car on 15-inch tyres and a luxury SUV on 21-inch runflats are both legal and both carry an MOT cap of £54.85, but their upkeep bills are not comparable. Across the two fixed legal items above, a UK driver's known annual bill starts at roughly £245 — around £190 of VED at the reference band plus £54.85 of MOT — before a single mile of fuel, and everything else in this section varies too widely to put a number on honestly.

UK fuel prices: what a litre costs at the pump
Petrol in the UK costs £1.64 per litre and diesel £1.86 as of September 2026, from the EU Oil Bulletin for the week of 31 August 2026. A 50-litre tank therefore costs about £82 for petrol and £93 for diesel — a £11 difference that is invisible on a weekly basis and worth £604 a year in our averages, because diesel engines are efficient enough to convert part of that premium back into miles.
For European context, the EU average is €1.840 per litre for petrol and €1.966 for diesel, which puts UK petrol above the EU average and UK diesel below it before any currency conversion. What matters for a UK budget is the pound price, and that is the number we have used on all 5,199 rows.
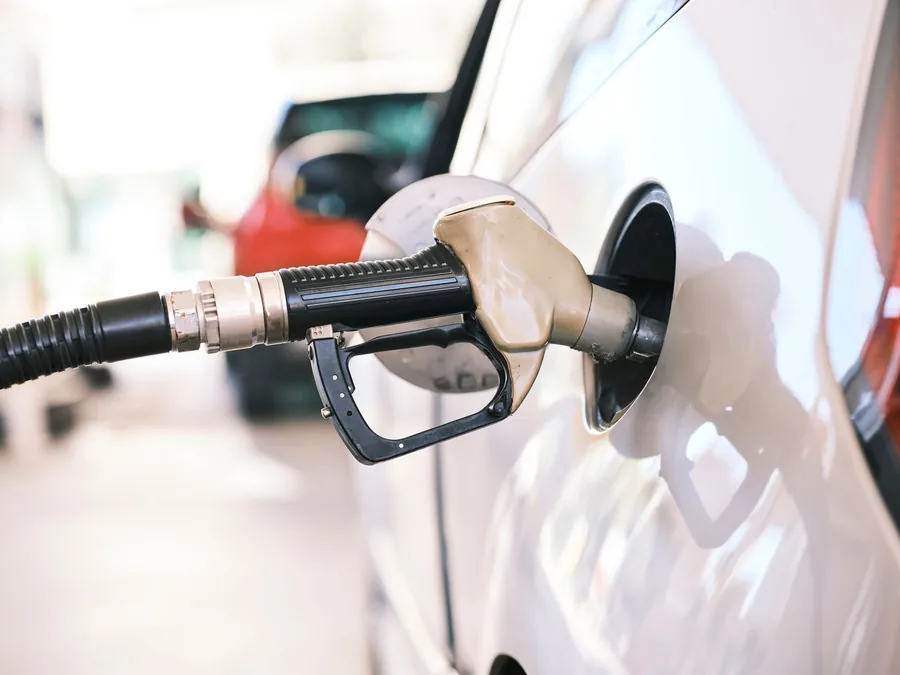
Electricity at £0.263 per kWh: the home charging case
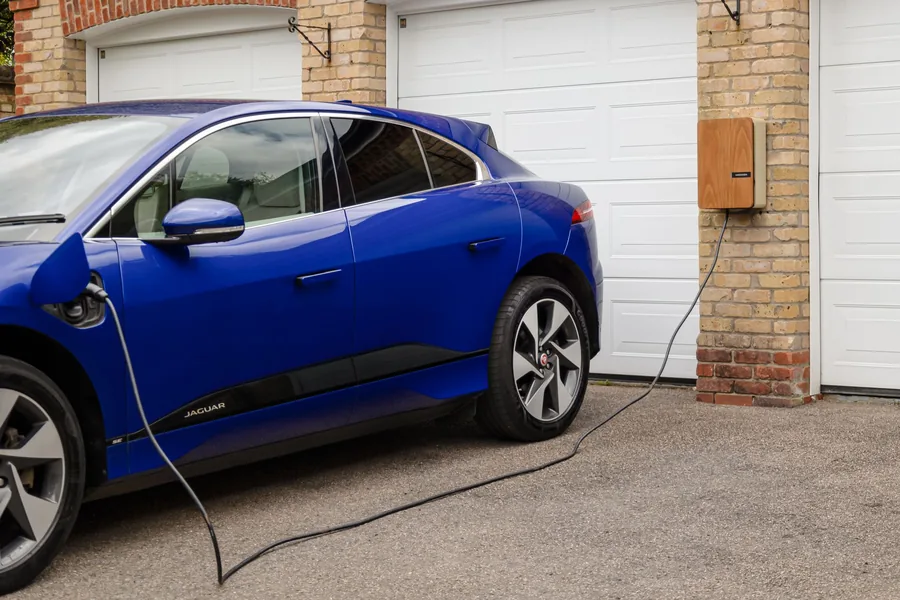
The electric figure in this guide is the Eurostat household price for band DC consumption, £0.263 per kWh including taxes, for the second half of 2025. That is the rate that applies if you charge at home on a standard domestic tariff. It is not the rate you pay on a public rapid charger, which is higher in the UK, so an EV driver who cannot charge at home will not achieve the £887 average in the table above — this is the single most important caveat in the whole analysis.
For drivers who can charge at home, the arithmetic is hard to argue with. The average electric car in the dataset uses 17.46 kWh/100km, which is £0.074 per mile at £0.263 per kWh, against £0.203 per mile for the average petrol car. Over 12,000 miles that is £887 versus £2,439.
A total cost of ownership illustration using sourced figures only
A total cost of ownership figure is only honest if every component is sourced. This table uses the annual energy cost from the VCA dataset, the £190 VED reference for the 111–130 g/km band and the £54.85 MOT cap — nothing else.
Even at that conservative level the spread is large: the cheapest petrol model costs £1,385 a year in known recurring costs, an average petrol car £2,684, an average electric car £1,132 and the most expensive model in the dataset, the 2026 McLaren GT, £7,751. On a per-mile basis the same four rows run from £0.115 to £0.646. Depreciation sits outside this table and is usually the biggest single cost of all: as a rough market guide, a typical new car loses 15–25% of its value in the first year and around half of it over five years, which for most UK buyers dwarfs everything in the energy column.
| Scenario | Consumption | Annual energy | Per mile | Known annual total (energy + VED + MOT) | Known cost per mile |
|---|---|---|---|---|---|
| Cheapest petrol model (Suzuki Celerio) | 3.6 L/100km | £1,140 | £0.095 | £1,385 | £0.115 |
| Cheapest diesel model (Peugeot 208) | 3.0 L/100km | £1,078 | £0.090 | £1,322 | £0.110 |
| Cheapest hybrid (Toyota Prius) | 3.0 L/100km | £950 | £0.079 | £1,195 | £0.100 |
| Cheapest electric (Mini Aceman) | 10.9 kWh/100km | £554 | £0.046 | £798 | £0.067 |
| Average petrol car | 7.70 L/100km | £2,439 | £0.203 | £2,684 | £0.224 |
| Average diesel car | 5.11 L/100km | £1,835 | £0.153 | £2,080 | £0.173 |
| Average hybrid car | 6.24 L/100km | £1,975 | £0.165 | £2,220 | £0.185 |
| Average electric car | 17.46 kWh/100km | £887 | £0.074 | £1,132 | £0.094 |
| Most expensive model (McLaren GT) | 23.7 L/100km | £7,506 | £0.626 | £7,751 | £0.646 |
Known annual total = annual energy + £190 VED reference + £54.85 MOT cap. Insurance, tyres, servicing, parking and depreciation are excluded because they are not in the source data.
What the data cannot tell you: insurance, tyres, parking and depreciation
Four significant costs sit outside this analysis, and pretending otherwise would make the rankings useless. Insurance is priced on your postcode, age, claims history, annual mileage and the car's insurance group, and quotes for two cars with identical fuel bills can differ by more than either car's annual fuel cost. Tyres depend on wheel size, brand and how you drive. Servicing depends on intervals, dealer labour rates and how long you keep the car.
Depreciation deserves its own line because it is usually the largest cost of all and the least visible. A new car typically loses 15–25% of its value in year one and about half of it over five years. If you are comparing two cars whose energy costs differ by a few hundred pounds a year, the depreciation curves and the insurance quotes will decide the outcome, not the litres per 100 km.
- Insurance — varies by driver, postcode and insurance group, not by fuel consumption
- Tyres, brakes and servicing — depend on wheel size, brand and mileage, not on the certified figure
- Parking, congestion and tolls — driven by where you live and drive, not by the car
- Depreciation — roughly 15–25% in year one and about 50% over five years for a typical new car
How to use these figures for your own car
The fastest route from this guide to a decision is to start with annual mileage, then powertrain, then the specifics of the individual car. Everything in the tables scales linearly, so you can move from our 12,000-mile assumption to your own figure in one multiplication.
The final step is the one most buyers skip: get insurance quotes for your shortlist before you commit. A difference between two insurance quotes can easily outweigh the entire energy advantage of switching powertrain, so a quote belongs in the comparison alongside the fuel figures.
- Write down your real annual mileage, not the number you would like it to be. Halve our 12,000-mile figures for 6,000 miles, double them for 24,000.
- Match the powertrain to the driving: city and short trips favour non-plug hybrids and small petrol cars, motorway miles favour efficient diesels, and home charging favours electric.
- Check the VED band of the exact model year you are buying, using the £190 rate as the reference for 111–130 g/km rather than a promise.
- Add the £54.85 MOT cap, then get insurance quotes for two or three shortlisted cars before deciding.
- Scale the winner with the calculators below using your own mileage, energy prices and ownership period.
The limits of official test figures
WLTP and its predecessor NEDC are laboratory cycles run at controlled temperatures on a rolling road, with no wind, no passengers, no roof load and no air conditioning. Real-world consumption is typically higher than the certified figure, and the gap widens in winter, at motorway speeds and whenever a plug-in hybrid runs beyond its electric range. None of that makes the certified numbers useless — they are the only consistent, legally mandated basis for comparing one car against another — but they are a ranked index rather than a promise.
Read the tables that way and they stay reliable: a car certified at 4.0 L/100km will almost always cost less to run than one certified at 6.0 L/100km, in the same hands and at the same pump price. Read them as a forecast of your exact annual spend and you will be disappointed, whatever you drive.
Use the free calculators
Frequently asked questions
What is the average annual running cost of a car in the UK in 2026?
The average petrol car in our 2,543-row UK sample costs £2,439 a year in fuel at £1.64 per litre and 12,000 miles, with a median of £2,122. Add the £190 VED reference for the 111–130 g/km band and the £54.85 MOT cap and the known floor is £2,684 before insurance, servicing, tyres or depreciation.
How much does it cost per mile to run a car in the UK?
Fuel alone costs £0.203 a mile for the average petrol car, £0.153 for the average diesel, £0.165 for the average hybrid and £0.074 for the average electric car at verified September 2026 prices. Adding VED and the MOT cap takes the average petrol car to £0.224 per mile and the average electric car to £0.094.
How much is VED for a car in the 111–130 g/km band?
Around £190 a year is the reference rate for the 111–130 g/km CO₂ band, which covers 1,127 of the 5,011 UK VCA rows carrying a CO₂ figure — 22% of them. The first-year rate on a new car differs from the standard rate, and the cleanest cars sit in lower bands, so always check the band of the exact model year you are buying.
Do diesel cars still cost less to run than petrol in the UK?
Yes, but by less than most people assume. The average diesel costs £1,835 a year against £2,439 for the average petrol car at 12,000 miles — a £604 saving, about 25%. But diesel costs £1.86 per litre against £1.64 for petrol, so the cheapest diesel in the dataset, the Peugeot 208 at £1,078, saves only £62 over the cheapest petrol.
Why were some hybrid cars excluded from the UK data?
The 2018 Range Rover and Range Rover Sport appear in the source tagged as hybrids at 2.8 L/100km and 64 g/km. Those are plug-in test figures achievable only with a full battery every trip, so both rows are excluded from the hybrid table and averages, along with four rows outside our plausibility bands and all 349 plug-in hybrid rows used only for reference.
Does an electric car really cost less to run than petrol?
On energy, clearly yes: £887 a year for the average electric car against £2,439 for the average petrol car at 12,000 miles, and £0.074 against £0.203 per mile. The catch is that this uses the household rate of £0.263 per kWh, so drivers who rely on public rapid charging will spend more, and depreciation on electric cars still has to be counted separately.