Is This Used Car Price Fair? How to Check a Used Car Valuation

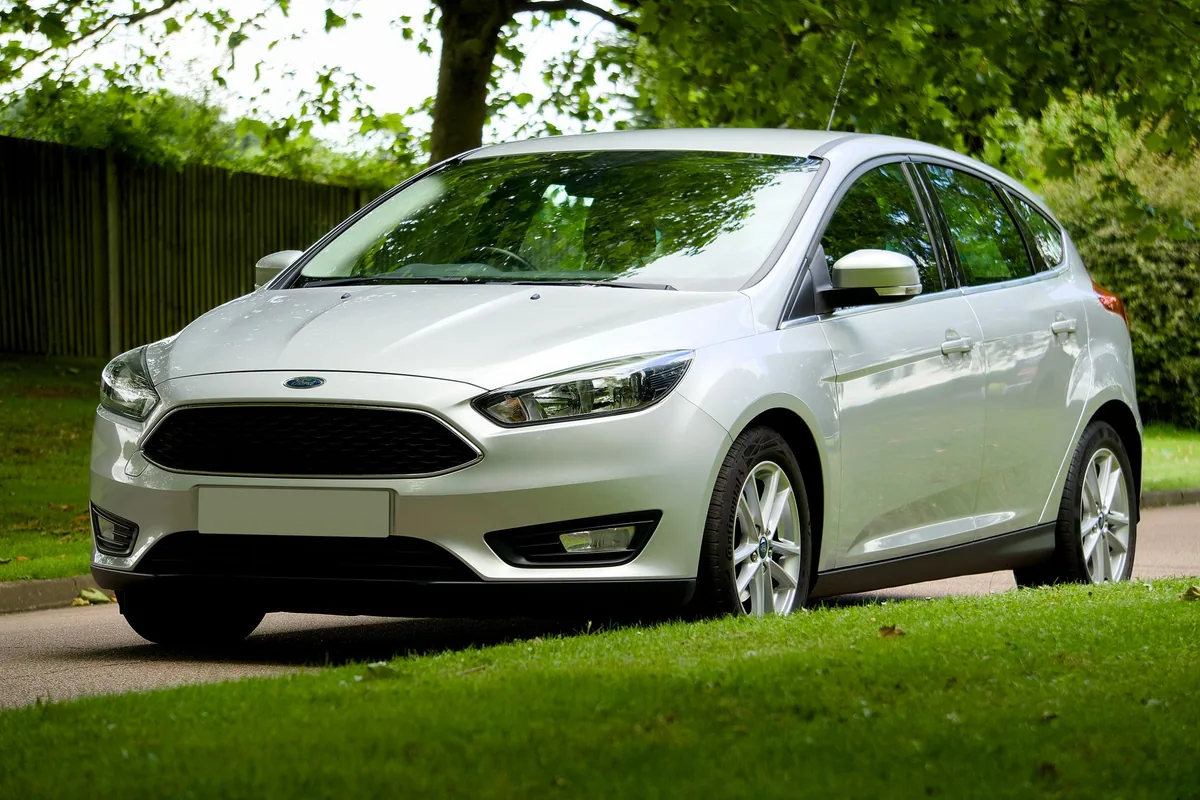
Most used car price checks begin with the biggest number in the advert and the least evidence behind it. The asking price is the seller's opinion. What can be proved is what the car will cost to keep on the road, because that comes from certified consumption and CO2 data for the exact model-year and fuel type.
This guide sets out a method you can run yourself: the four attributes that must match before two cars can be compared, where to look for evidence, why the certified CO2 band changes both your tax bill and the car's desirability, and how to sanity-check the seller's number against the records we hold. It publishes no used car prices, and the section below explains why.
Why a used car price check starts with the running cost
Price guides usually ask you to trust a market number nobody can audit. Our database holds 17,130 kept certified records across model years 2000 to 2027 and 124 makes, drawn from official Vehicle Certification Agency type-approval data in three datasets. Every record carries a make, model, model year, fuel type, a certified consumption figure in litres or kilowatt-hours per 100 km and, for almost all of them, a certified CO2 figure in grams per kilometre.
That gives you one verifiable number before you buy: what the car costs to run per year at fixed UK prices. Fuel or electricity is the largest recurring cost for most buyers, it is certified at source rather than estimated, and it varies far more between two cars of the same model year than buyers expect. The asking price is the seller's opinion. The running cost is not.
Every figure here is certified consumption, CO2, energy cost or a tax reference. No purchase price, price band or residual value appears anywhere in this post.
Why we publish no used car prices, and what would change that
We hold no used-car listings. Our database contains certified consumption, CO2 and range data only: no asking prices, no trade prices, no residual values, no sale records. This site therefore publishes no used car price, no price band, no residual value and no typical asking price. Not in this post, not in any table, not anywhere on KnowCarCost.
That is a house rule, not a gap we are waiting to fill. A band may be published only when it is backed by at least five to eight real, dated listings for the exact model-year, trim, mileage band and fuel type, with the number of listings shown to the reader. We have no such listings for any used car, so we publish none. A number with no source count behind it is worse than no number, because it looks authoritative while being uncheckable.
What would change our position is specific: a source of real, dated UK asking prices matched to a known specification, with five to eight examples per band and a visible count for each. Until that exists, the honest thing to do is teach the method and show you the certified data you can check for yourself.
What the certified data can and cannot tell you
We started from 17,270 raw records and dropped 140 before publishing anything, leaving 17,130 kept records: 8,920 from the archive dataset, 7,517 from the mega dataset and 693 from the current UK dataset. By fuel they are 9,201 petrol, 6,855 diesel, 490 hybrid, 402 plug-in hybrid and 182 electric. Coverage is densest where used buyers shop: 2013 carries 1,658 kept rows and 2018 carries 1,009.
The data gives you certified consumption, CO2, fuel type and model year, which together produce an annual energy cost at fixed UK prices. It cannot tell you anything about the specific car on the forecourt: not its mileage, condition, service history, accident repairs or outstanding finance. Those decide whether a price is fair, and they must be checked by hand.
- Checkable: consumption, CO2, fuel type, model year, annual energy cost
- Statistical: average consumption and CO2 for a whole model-year-fuel group
- Absent: mileage, condition, service history, accident history, finance, MOT advisories
The four attributes that must match before you compare anything
Two cars are comparable only when four things line up: model year, trim or spec, mileage band and fuel type. Drop one and you are comparing a car with a different car. The certified spread inside a single badge and year shows why. A 2012 Jaguar XF spans 149 to 292 g/km of CO2 across its certified rows, a 143 g/km spread. The 2013 Vauxhall Insignia five-door Sport Tourer spans 119 to 255 g/km, and the 2013 Volvo V60 spans 108 to 237 g/km.
CO2 sets the annual tax reference and consumption sets the energy bill, so two identical-looking cars from one model year can land in completely different bands depending on engine and trim. A seller quoting a specification that does not exist in the certified record for that year is either misreading a trim code or describing a different car.
Same badge, same model year, up to 143 g/km apart. Match trim and fuel before comparing, or the comparison means nothing.
A repeatable method to check a used car price yourself

- Note the exact model year, trim, fuel type and stated mileage from the advert, and save a copy in case it is edited
- Find the certified consumption and CO2 row for that model year and fuel type
- Convert consumption to an annual energy cost at your mileage and the current pump or electricity price
- Read CO2 into a band and check the DVLA rate table for that band and registration date
- Build a comparison set of five to eight genuinely comparable cars: same year, trim, fuel and similar mileage
- See where your car sits in that set, and by how much, then check the DVSA MOT history for gaps and advisories
- Confirm the registration, V5C name and finance status before agreeing anything
Where to look, and what each source is actually good for
Different sources answer different questions. Our certified records answer what the car should cost to run and what it was type-approved at. The DVSA MOT history answers what happened to this specific car at its annual tests. The DVLA rate tables answer which tax reference applies for a CO2 band and registration date. Listing platforms answer what comparable cars are advertised at now, which is market opinion rather than verified data.
Use them in that order and keep the categories separate. A certified consumption figure and an advertised asking price are not the same kind of number, and mixing them in one spreadsheet is how buyers talk themselves into a bad deal. Record where each number came from and when, because listings move and an out-of-date comparison is worthless.
- Certified records: consumption, CO2 and annual energy cost for a model year and fuel type
- DVSA MOT history: test dates, advisories, recorded mileage and failures for that registration
- DVLA rate tables: the annual tax reference for a CO2 band and registration date
- Manufacturer specification data: what the car was built with
- Listing platforms: current asking prices for comparable cars, checked against the specification
Why certified consumption and CO2 matter to the used car valuation
Two costs follow a used car as long as you own it, and both come off the certified record. Consumption sets the energy bill. CO2 sets the tax band and therefore a recurring bill many buyers only discover after the sale. Our UK reference for the 111 to 130 g/km band is around £190 a year. That is why a lower-CO2 variant of the same model year carries more value.
The bands are not evenly spread. Of the 16,946 kept records with a certified CO2 figure, 7,531 rows, or 44.4 per cent, sit at 171 g/km or above, while 4,284 rows, or 25.3 per cent, sit at or below 130 g/km. Roughly three certified records in four are above the band our £190 reference describes.
| CO2 band | Kept certified rows | Share of rows with certified CO2 |
|---|---|---|
| 171+ g/km | 7,531 | 44.4% |
| 131-150 g/km | 2,765 | 16.3% |
| 111-130 g/km (VED reference ~£190/yr) | 2,545 | 15.0% |
| 151-170 g/km | 2,366 | 14.0% |
| 110 g/km or below | 1,739 | 10.3% |
How to turn a certified record into an annual running cost
The conversion is deliberately simple so it is easy to audit: multiply certified consumption by annual distance and by the price of the energy. We use 12,000 miles a year, which is 19,312 kilometres, at £1.64 per litre for petrol, £1.86 for diesel and £0.263 per kilowatt-hour for household electricity. Hybrids are priced on petrol. One litre per 100 km of petrol therefore costs £316.72 a year, diesel £359.21, and one kilowatt-hour per 100 km of electricity £50.79.
Averaged across all kept records: petrol consumes 8.53 L/100km, produces 199.8 g/km and costs £2,701 a year in fuel; diesel 5.84 L/100km, 154.2 g/km, £2,096; hybrids 6.08 L/100km, 138.2 g/km, £1,927; electric 17.46 kWh/100km, £887. The average petrol car costs £1,814 a year more to fuel than the average electric car, and £604 more than the average diesel.

| Powertrain | Kept records | Average consumption | Average CO2 | Average annual energy cost |
|---|---|---|---|---|
| Petrol | 9,201 | 8.53 L/100km | 199.8 g/km | £2,701 |
| Diesel | 6,855 | 5.84 L/100km | 154.2 g/km | £2,096 |
| Hybrid (priced on petrol) | 490 | 6.08 L/100km | 138.2 g/km | £1,927 |
| Electric | 182 | 17.46 kWh/100km | not certified | £887 |
Worked example: two 2019 Toyota Corollas, £665 a year apart
This is a real comparison from the certified records, with nothing interpolated. A 2019 Toyota Corolla hybrid is certified at 5.1 L/100km and 116 g/km of CO2, which converts to £1,615 a year in petrol. A 2019 Corolla petrol is certified at 7.2 L/100km and 163 g/km, which converts to £2,280. Same model, same model year, same badge on the boot, and £665 a year between them.
The gap depends on which pair of rows you compare, which is why the trim matters. A second 2019 hybrid row is certified at 5.2 L/100km and 119 g/km, costing £1,647, and another petrol row is certified at 6.0 L/100km and 136 g/km at £1,900. Line up that hybrid against that petrol and the annual gap is £253. Same two cars on the forecourt, two different running-cost answers, and only the exact trim tells you which applies.
The 116 g/km hybrid row sits in the 111-130 band, while the 163 g/km petrol row sits two bands higher at 151-170.
Extending it to three and five years of ownership
Annual costs are easier to argue with multiplied out. A 2025 Toyota Corolla hybrid certified at 4.7 L/100km and 106 g/km costs £1,489 a year in energy, which is £4,466 over three years and £7,443 over five. Add the MOT at the £54.85 cap and that is £164.55 over three years and £274.25 over five, giving £4,630.29 of energy plus MOT over three years and £7,717.14 over five.
Run the same arithmetic on the 2019 pair and the difference compounds: £665 a year is £1,995 over three years and £3,325 over five. That is cash the cheaper-to-run car hands back to you. It does not set a purchase price; it sets a target for how much more the thirstier car would have to be discounted by before the two cost the same to own.
Sanity-checking the seller's number with the certified record
When a seller quotes a figure and a specification, you have two things to check. First, does the specification exist in the certified record for that model year, at that fuel type and roughly that consumption? If the advertised figures match no certified row, ask why. Second, what does the difference in running cost mean over your ownership horizon?
Suppose the two cars you are weighing up are £665 a year apart on certified data and you plan to keep the car for five years: that is £3,325 in certified running-cost difference. If the thirstier car is not discounted by materially more than that, you are paying twice, once for the car and again every year at the pump. If it has a better history, a longer warranty or the specification you want, you may still choose it, but you know what that choice costs and can negotiate with a real number.
Mileage changes the size of the problem, not the method
Certified consumption is a per-distance figure, so running cost scales in a straight line with the miles you do. Our 12,000 miles a year is a reference, not a rule. A certified 5.1 L/100km hybrid costing £1,615 a year at 12,000 miles costs roughly £1,077 at 8,000 miles and roughly £2,692 at 20,000 miles. Per mile at our constants, petrol averages £0.225, diesel £0.175, hybrid £0.161 and electric £0.074, so a 10,000-mile year costs about £2,250 in fuel for an average petrol car against £740 in household electricity for an average electric one.
Mileage also decides how much the fuel-type question matters. Where two variants are close on certified consumption the gap stays small however far you drive: the 2018 Ford Fiesta petrol row at 4.3 L/100km costs £1,362 a year against the diesel row at 3.8 L/100km at £1,365, a difference of £3. High mileage cannot rescue a decision the certified data says is a tie, and where the gap is real, mileage multiplies it.
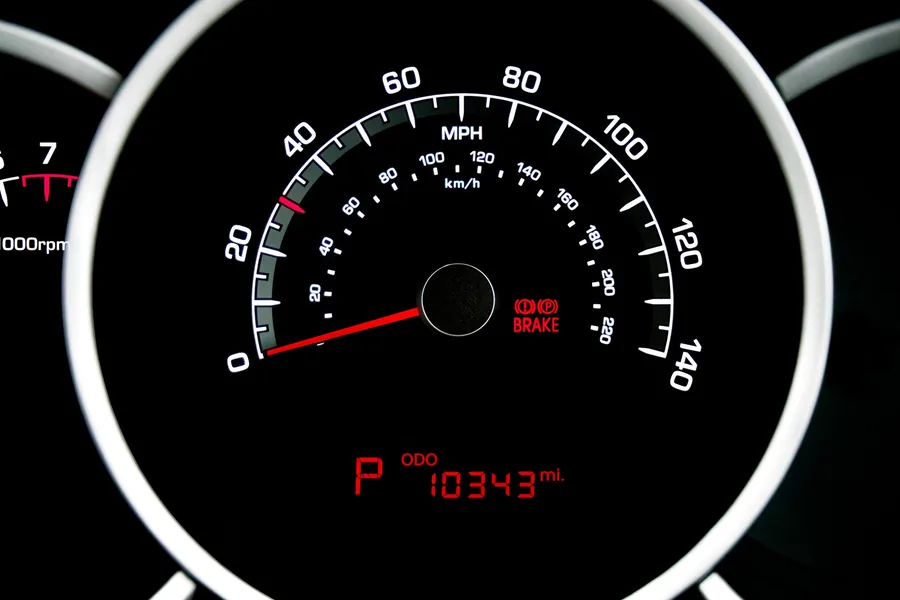
Per mile before tyres, servicing, insurance and tax: petrol average £0.225, diesel £0.175, hybrid £0.161, electric £0.074.
Small diesels are no longer the automatic running-cost win
Diesel still wins on consumption per kilometre, but it costs £1.86 a litre against £1.64 for petrol, and that changes the answer model by model. The 2018 Ford Fiesta rows show how thin the margin can be: 4.3 L/100km petrol at £1,362 a year against 3.8 L/100km diesel at £1,365, which makes the diesel three pounds a year dearer to fuel. Elsewhere the diesel advantage is large. The 2018 Nissan Qashqai diesel row at 3.8 L/100km costs £1,365 a year against £1,679 for the 5.3 L/100km petrol and £1,837 for the 5.8 L/100km petrol, saving between £314 and £472 a year depending on which petrol trim you were considering.
Older diesel hatchbacks follow the same pattern. A 2014 Skoda Octavia diesel at 3.2 L/100km and 85 g/km costs £1,149 a year against £1,552 for the 4.9 L/100km petrol at 114 g/km, a gap of £403 a year and £2,015 over five years. By 2016 the same comparison narrows to £295 a year as the diesel consumption figure rises to 3.5 L/100km. There is no blanket rule: the certified row for the exact model year and trim is the only thing that answers it, and the answer swings by hundreds of pounds either way.
Check the spec the seller quotes against the certified record
We clean the source data before publishing anything, and the exclusions are the same traps a buyer falls into. Of the 140 records we dropped, 129 were plug-in hybrids with no consumption figure at all. Eleven more were outside a plausible range: a 2026 Toyota Land Cruiser hybrid at 26.2 L/100km, a 2007 Kia Sorento diesel at 35.8 L/100km and a 2022 Mazda CX-60 petrol at 141.2 L/100km, plus very low figures from older plug-in models including a 2013 Chevrolet Volt at 1.2, a 2013 Toyota Prius at 2.1, a 2013 Vauxhall Ampera at 1.2, a 2013 Volvo V60 at 1.8, a 2018 Hyundai Ioniq at 1.1 and a 2018 Kia Niro at 1.3. Two 2018 Land Rover Range Rover rows, one standard and one Sport, were tagged as plain hybrids at 2.8 L/100km and dropped as plug-in mis-tags, because that figure assumes a fully charged battery on every trip.
The published rules are simple: litres per 100 km must fall between 2.5 and 25.0, kilowatt-hours per 100 km between 5.0 and 40.0, and any hybrid-tagged row below 3.0 L/100km is dropped as a plug-in mis-tag. The 402 plug-in hybrid rows that survived are kept for reference but never used as like-for-like evidence, because their official figure assumes a charged battery. When a seller quotes a headline consumption figure that looks impossibly good, this is usually why.
The widest certified running-cost gaps in the data
The largest like-for-like gaps in the certified records show how much is at stake when the variant is wrong, all quoted for one model, one year and two fuels. A 2018 Mercedes-Benz S-Class Limousine petrol row is certified at 14.1 L/100km against a diesel row at 5.8 L/100km, a gap of £2,382 a year and £11,912 over five years. A 2016 Vauxhall Insignia five-door hatchback petrol row at 10.5 L/100km sits against a diesel row at 3.9 L/100km, a gap of £1,925 a year and £9,623 over five. A 2006 Toyota Land Cruiser shows £1,894 a year between the 16.3 L/100km petrol and the 9.1 L/100km diesel, and £9,469 over five years.
These are extremes, not the norm, but they make the point sharply. The largest avoidable cost in a used-car purchase is often not the asking price at all: it is choosing the wrong engine variant of the right car and paying for it every year you own it. Certified data tells you which variant that is before you commit.
| Model and year | Comparison | Consumption A and B | Gap per year | Gap over 5 years |
|---|---|---|---|---|
| Mercedes-Benz S-Class Limousine 2018 | Petrol vs diesel | 14.1 vs 5.8 L/100km | £2,382 | £11,912 |
| Vauxhall Insignia five-door hatchback 2016 | Petrol vs diesel | 10.5 vs 3.9 L/100km | £1,925 | £9,623 |
| Toyota Land Cruiser 2006 | Petrol vs diesel | 16.3 vs 9.1 L/100km | £1,894 | £9,469 |
What a price check still needs that no dataset can supply
Certified data says what the car should cost to run. It says nothing about the car in front of you, and the things it cannot see are where a price is won or lost: mileage above or below average, service history gaps, accident repairs, worn tyres and brakes, a clutch near the end of its life, outstanding finance, a registration that does not match the keeper. None of these appear in a consumption table, and every one of them moves the fair price.
Treat certified data as the floor of your evidence, not the ceiling. It settles the running-cost argument before you arrive. Walk the car, read the MOT history, ask for the service record, confirm the finance position and pay for an independent inspection on anything you intend to buy.

- Mileage against the MOT record, and whether the service history matches the dates
- Condition of tyres, brakes, clutch and suspension, the first bills you will face
- Accident repair, paint mismatch or fresh underseal hiding corrosion
- Outstanding finance, and whether the seller is the registered keeper
- Warranty or approved-used cover that transfers with the car, and what it excludes
- How long the current owner has kept it, and whether the V5C name matches the seller
Red flags that are not about the price at all
Most buying guides rank red flags by how far below market the price sits, which is a test we deliberately cannot run. The flags that remain are about evidence and behaviour, and they are just as decisive. A seller who is not the registered keeper, a V5C that does not match the car, a service book with years missing, MOT advisories that repeat year after year, or a deposit demanded before you have seen the car in daylight are all reasons to stop. A mileage that contradicts the DVSA record ends the conversation immediately.
Price anomalies still matter, just not as numbers we will quote. If an advert sits far below everything comparable you can find and the seller will not explain why, something is being disclosed late, whether that is an insurance write-off category, a mechanical fault or finance that has not been cleared. Ask directly and get the answer in writing before any money moves.
- Seller is not the registered keeper, or the V5C details do not match the car
- Mileage inconsistent with the DVSA MOT history, or a gap in test dates
- Service history missing for whole years, with no invoices to fill the gaps
- The same advisory repeated at test after test, with no repair recorded
- Pressure for a deposit before viewing, or refusal to allow an inspection
A ten-step fairness routine before you commit
Run this once per serious candidate and keep the notes. It replaces the vague feeling that a price is about right with evidence you can argue from.
- Capture the advert: exact model year, trim, fuel type, stated mileage and asking price, with the date you saw it
- Find the certified consumption and CO2 row for that exact model year and fuel type
- Convert certified consumption to an annual energy cost at your mileage and current energy price
- Read the CO2 figure into a band and check the annual tax reference for that band and registration date
- Compare the same specification across at least five to eight comparable adverts and note where yours sits
- Project three-year and five-year energy plus MOT costs for your shortlist and compare the totals
- Ask whether the running-cost difference justifies the price difference, and negotiate with that figure
- Pull the DVSA MOT history for the registration and check dates, advisories and recorded mileage
- Confirm the seller is the registered keeper and that no finance is outstanding on the car
- Book an independent inspection before any money changes hands, then decide
Use the free calculators
Frequently asked questions
Why does KnowCarCost not publish a used car price or price band?
Because we hold no used-car listings. Our database contains certified consumption, CO2 and range data only. House policy allows a price band only when it is backed by at least five to eight real, dated listings for the exact model-year, trim, mileage band and fuel type, with the source count shown. We have none, so we publish no band for any car.
What should I compare when checking whether a used car price is fair?
Match four attributes first: model year, trim or specification, mileage band and fuel type. Certified data shows why, with a 2012 Jaguar XF spanning 149 to 292 g/km of CO2 and a 2013 Vauxhall Insignia spanning 119 to 255 g/km. Then compare five to eight genuinely comparable adverts and check the certified running cost for your own mileage.
How do I convert certified consumption into an annual running cost?
Multiply the certified figure by your annual distance and the energy price. At 12,000 miles a year, one litre per 100 km of petrol costs £316.72, diesel £359.21, and one kilowatt-hour per 100 km £50.79, using £1.64 a litre, £1.86 a litre and £0.263 per kWh. Hybrids are priced on petrol.
Does the CO2 figure really change what a used car is worth?
It changes a recurring bill. Certified CO2 sets the vehicle tax band, and our UK reference for the 111 to 130 g/km band is around £190 a year. Of 16,946 kept records with a certified CO2 figure, 44.4 per cent sit at 171 g/km or above and 25.3 per cent at or below 130 g/km, so band position is a real differentiator.
Is a diesel always cheaper to run than a petrol car?
No. Diesel costs £1.86 a litre against £1.64 for petrol, and individual model years decide it. A 2018 Ford Fiesta diesel at 3.8 L/100km costs £1,365 a year against £1,362 for the 4.3 L/100km petrol, three pounds more, while a 2018 Nissan Qashqai diesel saves £314 to £472 a year against its petrol variants.
What can I check myself before trusting a seller's specification?
Use the DVSA MOT history on GOV.UK for test dates, advisories and recorded mileage, the DVLA rate tables for the tax reference on the CO2 band, and manufacturer specification data for what the car was built with. Then check the consumption figure against the certified record for that model year and fuel type. A headline figure with no matching row is a warning sign.