What it really costs to own a car in Sweden


The cost of owning a car in Sweden starts with fuel, and in 2026 that is the strangest part of the equation. Petrol has been sitting at around 16.4 kr per litre and diesel at 19.29 kr per litre, but the temporary cut that pushed Swedish fuel taxation down to EU minimum levels is scheduled to expire on 30 September 2026. Every figure here is in Swedish kronor, built from official type-approval consumption data and those two pump prices, at 15,000 km a year.
Below you will find annual energy cost by powertrain with both mean and median, cost per 100 km, the cheapest and dearest models, and a total-cost split assembled only from figures we can source. Insurance, tyres, servicing and parking are discussed honestly as unknowns rather than guessed at.
What the cost of owning a car in Sweden covers
The cost of owning a car in Sweden has two halves. The first is energy, and it is the only half we can measure precisely: certified type-approval consumption for every model in our dataset, multiplied by 15,000 km a year and the verified Swedish prices of 16.4 kr per litre for petrol, 19.29 kr per litre for diesel and 3.02 kr per kWh for household electricity. The second half is everything else — fordonsskatt, besiktning, insurance, tyres, servicing, parking — where the honest answer is that the numbers vary too much for one published figure to mean anything.
So this guide does the two jobs separately. The tables give measured annual energy cost by powertrain in kronor, with mean and median so one extreme car cannot distort the picture. Tax and inspection use the only verified Swedish figures we hold: fordonsskatt of about 1,200 kr a year for a typical used car, and besiktning of about 500 kr.
All money in this guide is in Swedish kronor. Where a source figure is in euro it is quoted in euro, in its own currency, and is never converted, because inventing an exchange rate would be worse than leaving the two currencies side by side.
How the dataset was built
Every consumption figure below comes from official type-approval records held in three datasets: vca-uk, vca-mega and vca-archive. Together they contain 17,270 rows for the models analysed here; after cleaning, 17,130 rows were used. Annual cost is calculated from the certified figure: litres per 100 km divided by 100, multiplied by 15,000 km, multiplied by the Swedish pump price. For electric cars the same formula runs on kWh per 100 km at 3.02 kr per kWh.
One mileage and one price set across every row means the tables measure the car, not the driver. Drive 7,500 km instead of 15,000 and roughly halve every figure; drive 30,000 km and roughly double it. Because the ranking depends only on certified efficiency, it holds even if pump prices move after 30 September 2026 — the order of the table will not change, only the kronor amounts beside each model.
Data quality: 140 records removed
An average is only as good as the rows behind it, so 140 of the 17,270 records were excluded before any mean was calculated. The largest group is 129 plug-in hybrid rows carrying no certified consumption figure at all; the data simply does not record one. Nine more rows fell outside the plausible window of 2.5 to 25.0 litres per 100 km, and two hybrid-tagged rows were removed as plug-in mis-tags because they showed less than 3.0 litres per 100 km. No electric row was excluded: all 182 fell inside the 5.0 to 40.0 kWh per 100 km window.
The individual rows show what bad data looks like. A 2022 Mazda CX-60 is listed at 141.2 L/100km and a 2007 Kia Sorento diesel at 35.8 L/100km, both impossible for a road car. The mis-tagged rows are a 2018 Range Rover and a 2018 Range Rover Sport, both at 2.8 L/100km, which is a plug-in test figure rather than a hybrid one. Rejected plug-in entries also include a Hyundai IONIQ at 1.1 L/100km and a Kia Niro at 1.3.
The Swedish constants we used
Two conversions we deliberately did not make. Sweden's prices are in kronor and the EU reference figures are in euro, and no exchange rate is invented here to bridge them. For context, in their own currency, the EU average was EUR 1.840 per litre for petrol and EUR 1.966 for diesel in the week of 31 August 2026, and Eurostat put EU average household electricity at EUR 0.220 per kWh in the second half of 2025. Sweden's own household rate that half-year was EUR 0.271, below Germany at EUR 0.387 and far below Ireland at EUR 0.404.
The fuel figure carries a deadline. Sweden's temporary fuel-tax cut, which brought taxation down to EU minimum levels, is scheduled to expire on 30 September 2026. If it is not extended, the kronor amounts in every table move up from 1 October. Consumption figures do not change, so the comparisons between powertrains hold; only the size of each annual bill changes. Our constants are petrol at 16.4 kr/L, diesel at 19.29 kr/L, household electricity at 3.02 kr/kWh, an annual distance of 15,000 km, fordonsskatt of about 1,200 kr and a besiktning allowance of about 500 kr.
Petrol: mean and median annual energy cost
Petrol is the largest slice in the dataset: 9,201 rows covering 3,966 distinct models. Mean consumption is 8.53 L/100km, which at 16.4 kr per litre and 15,000 km costs 20,976 kr a year, or 139.84 kr per 100 km. The median is lower at 7.80 L/100km — 19,188 kr a year and 127.92 kr per 100 km. The gap between the two is the signature of a long tail: a small number of very thirsty cars drag the average up by 1,796 kr.
That tail is wide. The most economical petrol row is 3.4 L/100km, which works out at 8,364 kr a year and 55.76 kr per 100 km — about 14% of the cost of the thirstiest petrol row, at 61,254 kr. Both are certified values for real cars. Within the petrol list alone, the swing from best to worst is 52,890 kr a year.
The cheapest petrol cars to run in Sweden in 2026
Every model at the top of the petrol table is a small city car or supermini. The 3.4 L/100km Honda Insight of 2000 to 2004 is the lowest certified petrol figure in the dataset, at 8,364 kr a year, followed by the 2017 Suzuki Celerio at 3.6 L/100km and 8,856 kr, then a tight group at 3.8 L/100km — the Citroen C1, Citroen New C1 and Fiat 500 and 500C — all at 9,348 kr a year and 62.32 kr per 100 km.
The pattern matters more than the names. Nothing larger than a supermini appears until consumption passes 4.0 L/100km, and the difference between the best petrol car and the petrol median is 10,824 kr a year. These cars are light on carbon dioxide, which feeds into the tax discussion later, but the trade is space and pace: four seats, small boots and engines that feel strained at motorway speeds with a full load.
| Model | Year | L/100km | kr/yr |
|---|---|---|---|
| Honda Insight | 2000-2004 | 3.4 | 8,364 |
| Suzuki Celerio | 2017 | 3.6 | 8,856 |
| Citroen C1 | 2016 | 3.8 | 9,348 |
| Fiat 500, 500C | 2017-2018 | 3.8 | 9,348 |
Diesel at 19.29 kr per litre
Diesel is the second-largest slice at 6,855 rows and 3,033 distinct models. Mean consumption is 5.84 L/100km, which at 19.29 kr per litre costs 16,885 kr a year, or 112.57 kr per 100 km. The median is 5.50 L/100km, or 15,914 kr and 106.09 kr per 100 km. In kronor the mean diesel bill sits 20% below the mean petrol bill, and the median 17% below the median.
That gap is smaller than the consumption gap suggests, and the reason is the pump price. Diesel costs 19.29 kr per litre against 16.4 kr, a premium of roughly 18%, so a diesel has to be substantially more efficient to win. The best diesel is the 2017 Peugeot 208 at 3.0 L/100km and 8,680 kr, only 316 kr cheaper than the best petrol car, while the median diesel beats the median petrol by 3,274 kr. Diesel's advantage here is real but modest, and at low mileage it evaporates.
| Model | Year | L/100km | kr/yr |
|---|---|---|---|
| Peugeot 208 | 2017 | 3.0 | 8,680 |
| Peugeot 308 | 2017 | 3.1 | 8,970 |
| Kia Rio | 2011-2014 | 3.2 | 9,259 |
| Hyundai i20 | 2012-2016 | 3.2 | 9,259 |
| Peugeot 308 SW | 2017 | 3.2 | 9,259 |
Hybrids: the cheapest combustion option
With the mis-tagged plug-in rows removed, 490 hybrid rows and 344 distinct models remain. Hybrids are priced here at the petrol rate of 16.4 kr per litre, because every hybrid row in these datasets is a petrol hybrid. Mean consumption is 6.08 L/100km, giving 14,964 kr a year and 99.76 kr per 100 km. The median is 5.85 L/100km, or 14,391 kr and 95.94 kr per 100 km. That puts the hybrid mean 29% below the petrol mean and the hybrid median 25% below the petrol median.
The leaderboard is a Toyota list. The 2018 Toyota Prius at 3.0 L/100km costs 7,380 kr a year, the cheapest combustion figure in the whole dataset and cheaper than every diesel. The Yaris hybrid follows at 3.3 L/100km and 8,118 kr, with the 2017 Hyundai IONIQ at 3.4 L/100km and 8,364 kr. Hybrid does not guarantee economy, though: a 2026 Mercedes-Benz G-Class sits at 14.7 L/100km and 36,162 kr, more than any diesel in the set.
| Model | Year | L/100km | kr/yr |
|---|---|---|---|
| Toyota Prius | 2016-2018 | 3.0 | 7,380 |
| Toyota Yaris Hybrid | 2016-2018 | 3.3 | 8,118 |
| Toyota Prius, MY18 | 2018 | 3.4 | 8,364 |
| Hyundai IONIQ | 2017 | 3.4 | 8,364 |
Electric cars: 4,938 kr a year at the efficient end
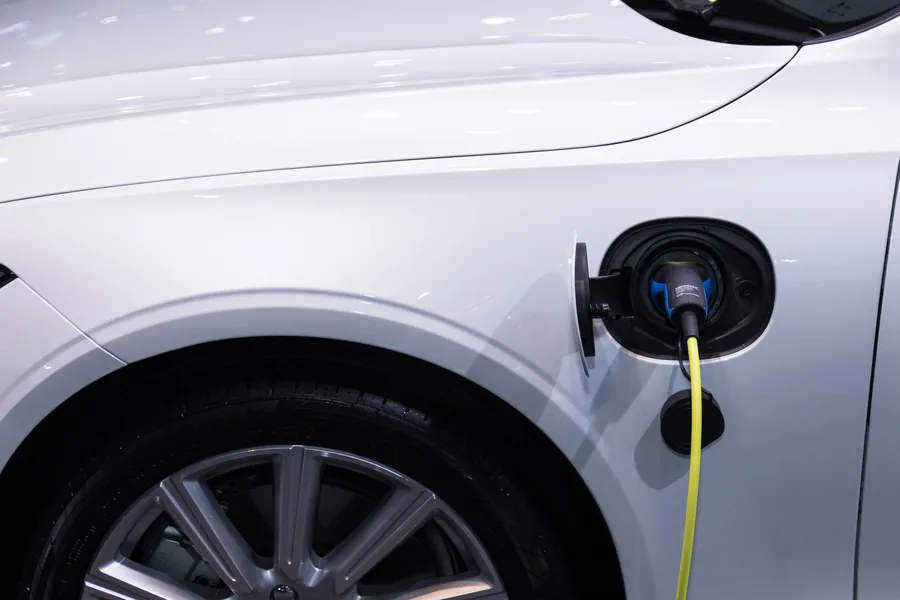
Electric is the smallest group — 182 rows and 160 distinct models — and by a distance the cheapest to run. Mean consumption is 17.46 kWh per 100 km, which at 3.02 kr per kWh costs 7,909 kr a year, or 52.73 kr per 100 km. The median is 16.90 kWh per 100 km, or 7,656 kr and 51.04 kr per 100 km. Against petrol, the mean electric car saves 13,067 kr a year, about 62%, and even a median-to-median comparison saves 11,532 kr.
The spread inside the electric list is far narrower than in petrol: from the 2026 MINI Aceman at 10.9 kWh per 100 km and 4,938 kr a year to the 2026 Mercedes-Benz G-Class at 30.3 kWh per 100 km and 13,726 kr. Even the thirstiest electric car costs less to run than the median diesel. A 60 kWh battery charged at home from empty works out at about 181 kr, which is the arithmetic behind the whole table. Charging on public rapid chargers would weaken that advantage, but not reverse it.
| Model | Year | kWh/100km | kr/yr |
|---|---|---|---|
| MINI Aceman | 2026 | 10.9 | 4,938 |
| Mercedes-Benz CLA | 2026 | 12.2 | 5,527 |
| Dacia Spring | 2026 | 12.5 | 5,662 |
| Fiat 500 | 2025 | 13.3 | 6,025 |
| Tesla Model 3 | 2026 | 13.8 | 6,251 |
Energy cost by powertrain
This is the table to remember if you read nothing else. The ordering is petrol, diesel, hybrid, electric — but the distances between them are not equal. Diesel is 17% cheaper than petrol at the median, hybrid 25%, and electric 60%. In kronor, the whole combustion range from the petrol median down to the hybrid median is 4,797 kr, while the electric median of 7,656 kr sits 6,735 kr below the hybrid.
Read the gap between mean and median in each row as a measure of how much the average is distorted by expensive cars. Petrol has the widest gap at 1,796 kr, because the dataset includes hypercars and large luxury SUVs. Diesel's gap is 984 kr and hybrid's 566 kr. Electric has the narrowest at 254 kr, because every electric car in the set is reasonably efficient. A small mean-median gap is a powertrain where the typical buyer and the average row agree.
| Powertrain | Rows | Mean | Median | Mean kr/yr | Median kr/yr |
|---|---|---|---|---|---|
| Petrol | 9,201 | 8.53 L/100km | 7.80 L/100km | 20,976 | 19,188 |
| Diesel | 6,855 | 5.84 L/100km | 5.50 L/100km | 16,885 | 15,914 |
| Hybrid | 490 | 6.08 L/100km | 5.85 L/100km | 14,964 | 14,391 |
| Electric | 182 | 17.46 kWh/100km | 16.90 kWh/100km | 7,909 | 7,656 |
Cost per 100 km
Annual totals assume 15,000 km, which will be wrong for many readers. Cost per 100 km is easier to scale. At the mean, petrol is 139.84 kr per 100 km, diesel 112.57 kr, hybrid 99.76 kr and electric 52.73 kr. At the median the figures are 127.92 kr, 106.09 kr, 95.94 kr and 51.04 kr. Divide once more and the median petrol car costs about 1.28 kr per kilometre, while the median electric car costs about 51 ore.
Use these for a one-off journey. A 500 km drive in a median petrol car costs roughly 640 kr in fuel; the same trip in a median electric car costs about 255 kr. Both are plain arithmetic from the tables above, but they hold only if you set off with a full tank or a full battery. Recharging on the road at commercial prices is a different calculation, and it is the biggest reason a real electric running cost differs from the certified one.
The dearest cars to run
At the top of the petrol table sit the Lamborghini Diablo at 24.9 L/100km and 61,254 kr a year, and the 2026 McLaren GT at 23.7 L/100km and 58,302 kr. Both fall inside the 25.0 L/100km window we set, so they are genuine certified values rather than data errors — they simply belong to cars bought for reasons other than running cost. A 2005 Maserati MC12 is third at 23.0 L/100km and 56,580 kr.
The more interesting comparison is across powertrains at the same end of the market. The dearest hybrid, a 2026 Mercedes-Benz G-Class at 14.7 L/100km, costs 36,162 kr a year; the dearest diesel, an INEOS Grenadier at 12.2 L/100km, costs 35,301 kr. The dearest electric, the electric G-Class at 30.3 kWh per 100 km, costs 13,726 kr, still below the median diesel bill of 15,914 kr. Inefficiency costs far less at the electric end of the market.
| Model | Year | Consumption | kr/yr |
|---|---|---|---|
| Lamborghini Diablo | 2000 | 24.9 L/100km | 61,254 |
| McLaren GT | 2026 | 23.7 L/100km | 58,302 |
| Mercedes-Benz G-Class hybrid | 2026 | 14.7 L/100km | 36,162 |
| INEOS Grenadier diesel | 2026 | 12.2 L/100km | 35,301 |
| Mercedes-Benz G-Class electric | 2026 | 30.3 kWh/100km | 13,726 |
Fordonsskatt and besiktning
Fordonsskatt is the annual Swedish vehicle tax. The verified figure used here is about 1,200 kr a year for a typical used car. It is not fixed: the amount depends on the car's carbon dioxide figure and on when it was first registered, and newly registered high-emission cars pay considerably more in their early years before the rate falls. Treat 1,200 kr as a planning figure and check the specific vehicle before you buy, because the tax attaches to the car rather than the driver.
Besiktning is the roadworthiness inspection, priced at about 500 kr. Unlike fordonsskatt it is not an annual charge: you pay it when an inspection is due, and how often that happens depends on the vehicle. We include a 500 kr allowance in the totals below so the line is not forgotten, but the honest presentation is as an event cost rather than a subscription.
A sourced total cost of ownership split
This split is built only from figures we can source: median energy cost from the dataset, fordonsskatt of about 1,200 kr, and a besiktning allowance of about 500 kr. It is deliberately incomplete, and the incompleteness is the point. Energy accounts for 92% of the petrol total, 90% of the diesel total, 89% of the hybrid total and 82% of the electric total. Because the two fixed lines are identical across all four rows, the ranking is unchanged and electric remains cheapest by a wide margin.
The electric row deserves a caveat the arithmetic cannot express. Its advantage assumes home charging at 3.02 kr per kWh. Charge exclusively on public rapid chargers and the energy line grows, potentially past the hybrid figure. That is not a reason to avoid an electric car in Sweden; it is a reason to be honest about where the electricity comes from before using a table like this to decide anything.
| Powertrain (median) | Energy | Fordonsskatt | Besiktning | Total |
|---|---|---|---|---|
| Petrol | 19,188 kr | 1,200 kr | 500 kr | 20,888 kr |
| Diesel | 15,914 kr | 1,200 kr | 500 kr | 17,614 kr |
| Hybrid | 14,391 kr | 1,200 kr | 500 kr | 16,091 kr |
| Electric | 7,656 kr | 1,200 kr | 500 kr | 9,356 kr |
What is not in these figures
Four significant costs are missing from every table on this page, and no figure is invented to fill the gap. Insurance varies widely with driver, age, location, car and claims history; two owners of the same model can pay very different premiums. Tyres depend on size and on how you drive, and in Sweden winter tyres are a matter of safety rather than an optional upgrade, so most owners store a second set. Servicing and repairs depend on age and mileage. Parking can be free in a small town and expensive enough in a city centre to rival the energy bill.
For a fuller picture, get an insurance quote for the exact car you are considering, and ask what a set of winter tyres costs in the size it uses. Those two questions typically move the annual number more than the difference between two similar models in the fuel tables. We would rather tell you these lines are unmeasured than publish a national average that would not describe your situation.
Winter in Sweden: the real bill is higher
Every figure here is a laboratory test run in temperate conditions, with no wind, no roof load and no cold start. A Swedish winter changes the arithmetic. Cold air is denser, engine and cabin warm-up burns fuel before the car has moved a metre, and electric cars in particular lose range in low temperatures because battery chemistry and cabin heating both take a share of the energy. Real-world consumption is therefore higher than the certified figure in most Swedish use.
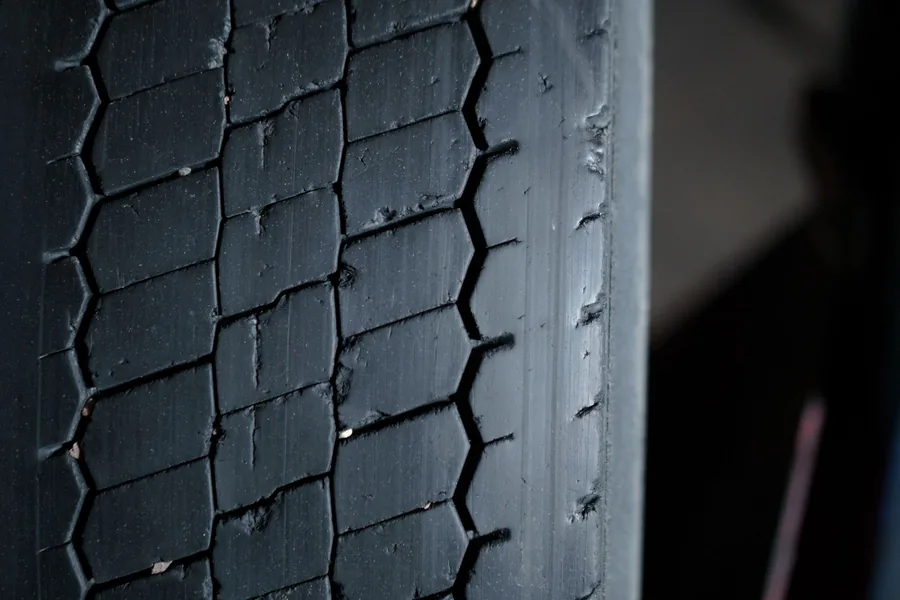
Winter adds costs the tables never see: a second set of wheels and tyres, studded or friction winter rubber, storage for the set you are not using, and more frequent washing to keep road salt off the underside. None of these are optional in practice at northern latitudes. Treat the annual figures here as a floor for a well-driven summer car, not a ceiling for a full Swedish year.

The 30 September 2026 fuel-tax deadline
Sweden's temporary fuel-tax cut, which held taxation at EU minimum levels, is scheduled to expire on 30 September 2026. If it is not extended, pump prices rise from 1 October and every kronor figure in this guide moves up with them. The size of that increase is not something we can quantify from verified data, and we will not guess at it.
What can be said confidently is what does not change. Certified consumption per 100 km is a property of the car, fixed at type approval. The ordering of the tables — electric cheapest, then hybrid, diesel and petrol — reflects the physical efficiency of each powertrain and a price ratio, not the tax rate. If fuel taxes rise, every combustion figure rises roughly in proportion, which widens the kronor gap between petrol and electric even as the percentage gap narrows slightly.
From certified figure to dashboard
The jump from a certified figure to what appears on your own dashboard is where most ownership-cost estimates go wrong. The type-approval number is a test result; your car carries passengers, roof boxes, air conditioning and a driving style that no test cycle reproduces. The direction of the error is always the same — real consumption is higher than certified — and the only open question is how much.
The practical response is not to hunt for a better number but to use the right one for the decision in front of you. If two cars in the same class differ by 1.0 L/100km, the more efficient one will almost certainly cost less in your hands too, because the same driving behaviour scales both. What changes with driving style is the size of the saving, not its sign.
Using these numbers for your own car
Work through the five steps below in order and you will have a defensible annual figure in a few minutes, in kronor, with every assumption visible.
None of it needs a subscription or a spreadsheet. The point of publishing the underlying data is that you can check our arithmetic against your own situation and see which assumption moves your number. If your result differs from the tables above, that is the useful signal: it tells you whether you are driving more, paying more, or driving something thirstier than the dataset median.
- Find your car's certified consumption in L/100 km or kWh/100 km, and confirm which test cycle it came from.
- Multiply by your own annual distance rather than ours: litres or kWh divided by 100, times kilometres driven.
- Multiply by the Swedish price you actually pay: 16.4 kr per litre for petrol, 19.29 kr for diesel, 3.02 kr per kWh at home.
- Add fordonsskatt of about 1,200 kr a year and a besiktning allowance of about 500 kr.
- Add your insurance quote, your tyre situation and your parking arrangements as separate lines, and keep them visible so you remember which figures were estimated.
Key takeaways on the cost of owning a car in Sweden
Five findings hold across all 17,130 cleaned rows. Annual energy cost at 15,000 km runs from a petrol mean of 20,976 kr and median of 19,188 kr, through diesel at 16,885 kr and 15,914 kr and hybrid at 14,964 kr and 14,391 kr, down to electric at 7,909 kr and 7,656 kr. Cost per 100 km follows the same order. The spread between the cheapest and dearest petrol car is 52,890 kr a year. The most efficient petrol car costs 8,364 kr, more than the average electric car's 7,909 kr.
Use the calculators below for your own mileage and your own car, and use the tables here to sanity-check the answer you get. If the two disagree by a wide margin, the difference is worth understanding before you buy anything.
Use the free calculators
Frequently asked questions
How much does it cost to run a car in Sweden each year?
Energy alone at 15,000 km costs the median petrol car 19,188 kr a year, diesel 15,914 kr, hybrid 14,391 kr and electric 7,656 kr. Fordonsskatt adds about 1,200 kr and besiktning about 500 kr. Insurance, tyres, servicing and parking vary widely.
What is the cheapest car to run in Sweden?
The 2026 MINI Aceman is cheapest overall at 10.9 kWh per 100 km, or 4,938 kr a year in electricity. Among combustion cars the 2018 Toyota Prius hybrid leads at 3.0 L/100km and 7,380 kr, ahead of the Honda Insight petrol at 8,364 kr.
Is petrol or diesel cheaper in Sweden?
Diesel needs less fuel but costs more per litre: 19.29 kr against 16.4 kr, a premium of roughly 18%. At the median it still costs less over a year, 15,914 kr against 19,188 kr, but the 3,274 kr gap may not repay a higher purchase price at low mileage.
How much is fordonsskatt in Sweden?
We use about 1,200 kr a year as a planning figure for a typical used car. It is not fixed: the amount depends on the car's carbon dioxide figure and its first registration date, and high-emission cars pay more in their early years.
What does a bilbesiktning inspection cost?
About 500 kr. It is a charge per inspection rather than an annual one, and how often an inspection is due depends on the vehicle, so we show it as an event cost and allow 500 kr in the total cost table.