Cheapest cars to run in the UK: 2026 running-cost ranking from official VCA data


The cheapest cars to run in the UK for 2026 are not the ones with the lowest sticker price — they are the models that burn the least fuel or electricity per mile, year after year. Our ranking uses 4,549 official Vehicle Certification Agency records to show exactly what each powertrain costs at current UK prices.
This guide breaks down the cheapest petrol, diesel, hybrid and electric models, explains why the diesel advantage has narrowed, why official plug-in hybrid figures cannot be trusted, and what the numbers do not include so you can decide which car fits your budget and mileage.
How the 2026 UK cheapest-to-run ranking was built
Every figure in this guide comes from the UK Vehicle Certification Agency database — the official source for type-approval fuel consumption and CO₂ data. We analysed 4,549 unique make-model-year-fuel records covering model years 2015 to 2027, applied the verified UK market constants of £1.64 per litre petrol, £1.86 per litre diesel and £0.263 per kWh household electricity, and assumed 12,000 miles of annual driving. Annual fuel cost is calculated directly from the official combined WLTP or NEDC figure: litres per 100 km multiplied by distance, multiplied by price. For electric vehicles the same formula uses kWh per 100 km. The £190 VED reference for the 111–130 g/km band and the £54.85 MOT cap are noted for context but are not added to the fuel totals shown in the tables.
The constants come from the EU Oil Bulletin (week 31 August 2026) for pump prices and Eurostat household electricity band DC for H2 2025. Using a single consistent mileage and price set across all 4,549 records means the ranking reflects only the vehicle's certified efficiency — not local price variation, driving style, or charging habits. This makes the tables a pure efficiency index that you can scale to your own mileage and energy costs.
MOT £54.85 cap and VED ~£190/yr are reference figures only — they are not included in the annual fuel costs shown.
Data quality disclosure: four implausible records and two mis-tagged Range Rovers
Before publishing any ranking we clean the source data. Four records were excluded as implausible source artefacts: a 2026 Toyota Land Cruiser hybrid listed at 26.2 L/100km, a 2022 Mazda CX-60 petrol at 141.2 L/100km, a 2018 Hyundai Ioniq plug-in hybrid at 1.1 L/100km and a 2018 Kia Niro plug-in hybrid at 1.3 L/100km. These values are either data-entry errors or test-cycle artefacts that do not represent real-world performance. Separately, the source tags some plug-in hybrids as plain hybrids. Two Land Rover Range Rover rows show 2.8 L/100km — an official plug-in test figure that is not achievable in real use because it assumes a fully charged battery for every trip. Those rows are removed from the hybrid table and are not counted in the hybrid averages.
Cheapest petrol cars: the full leaderboard in three tiers
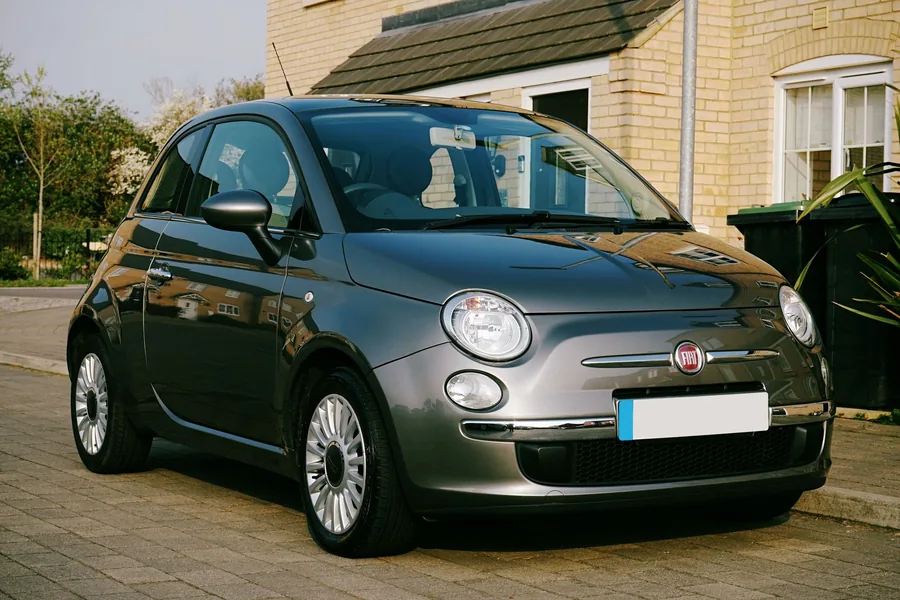
The petrol table is led by the 2017 Suzuki Celerio at 3.6 L/100km and £1,140 per year. A tight cluster of city cars and superminis sits between 3.8 and 4.2 L/100km, all costing between £1,204 and £1,330 annually. The top tier (3.6–3.8 L/100km) includes the Celerio, Fiat 500 & 500C, Citroën C1 and Kia Niro. The second tier (4.0 L/100km) adds the Peugeot 308, Hyundai i10, Smart fortwo coupé, while the third tier (4.1–4.2 L/100km) covers the Peugeot 108, SEAT Mii, Toyota Aygo, Škoda Citigo, Volkswagen Polo and Up, Fiat Panda, Peugeot 308 SW, Smart forfour and Audi A1. Every model in this list is a small hatchback or city car — larger petrol models do not appear until consumption rises above 5 L/100km.
The Celerio's 3.6 L/100km is the lowest certified petrol figure in the entire UK dataset. Over 12,000 miles the Celerio saves about £1,314 versus the petrol average. These cars also tend to sit in the lowest VED bands (many under 100 g/km CO₂), so the tax bill is lower too. The trade-off is space: all are four-seaters with limited boot room, and most use naturally aspirated engines that feel strained on motorways.
| Make | Model | Year | Consumption | CO₂ | Annual fuel |
|---|---|---|---|---|---|
| Suzuki | Celerio | 2017 | 3.6 L/100km | 84 g/km | £1,140 |
| Fiat | 500 & 500C | 2018 | 3.8 L/100km | 90 g/km | £1,204 |
| Citroën | C1 | 2016 | 3.8 L/100km | 88 g/km | £1,204 |
| Kia | Niro | 2018 | 3.8 L/100km | 88 g/km | £1,204 |
| Peugeot | 308 | 2017 | 4.0 L/100km | 95 g/km | £1,267 |
| Hyundai | i10 | 2017 | 4.0 L/100km | 93 g/km | £1,267 |
| Smart | fortwo coupé | 2016 | 4.0 L/100km | 98 g/km | £1,267 |
| Peugeot | 108 | 2018 | 4.1 L/100km | 95 g/km | £1,299 |
| SEAT | Mii | 2018 | 4.1 L/100km | 95 g/km | £1,299 |
| Toyota | Aygo | 2018 | 4.1 L/100km | 95 g/km | £1,299 |
| Škoda | Citigo | 2016 | 4.1 L/100km | 95 g/km | £1,299 |
| Volkswagen | Polo | 2016 | 4.1 L/100km | 94 g/km | £1,299 |
| Volkswagen | Up | 2016 | 4.1 L/100km | 95 g/km | £1,299 |
| Fiat | Panda | 2018 | 4.1 L/100km | 95 g/km | £1,299 |
| Peugeot | 308 SW | 2017 | 4.2 L/100km | 99 g/km | £1,330 |
| Smart | forfour | 2018 | 4.2 L/100km | 96 g/km | £1,330 |
| Audi | A1 | 2018 | 4.2 L/100km | 97 g/km | £1,330 |
Cheapest diesel cars: why the diesel advantage has shrunk
The 2017 Peugeot 208 leads the diesel table at 3.0 L/100km and £1,078 per year — only £62 less than the cheapest petrol Celerio. Ten models sit between 3.0 and 3.3 L/100km, with annual costs from £1,078 to £1,185. The Peugeot 308, Ford Fiesta, Peugeot 308 SW, Hyundai i20, Nissan Micra, Renault Clio Sport Tourer, Vauxhall Corsa 3-door and Renault Clio complete the list. Diesel still wins on pure fuel cost per mile because diesel contains more energy per litre and diesel engines run leaner, but the gap has narrowed for three reasons: pump diesel now costs £1.86/L versus £1.64/L for petrol (a 13% premium), modern petrol turbo engines have closed the thermal-efficiency gap, and the VED system no longer gives diesel a structural tax advantage. For drivers covering 12,000 miles a year the annual saving is modest; at lower mileages the higher purchase price of a diesel variant may never pay back.
This is a dramatic change from a decade ago when diesel was both cheaper at the pump and more efficient. Today the diesel advantage only appears at high mileage or when towing, where the torque characteristics still matter. The list is dominated by B-segment hatchbacks; larger diesel SUVs typically consume 5–6 L/100km.

| Make | Model | Year | Consumption | CO₂ | Annual fuel |
|---|---|---|---|---|---|
| Peugeot | 208 | 2017 | 3.0 L/100km | 79 g/km | £1,078 |
| Peugeot | 308 | 2017 | 3.1 L/100km | 82 g/km | £1,114 |
| Ford | Fiesta | 2017 | 3.2 L/100km | 82 g/km | £1,149 |
| Peugeot | 308 SW | 2017 | 3.2 L/100km | 85 g/km | £1,149 |
| Hyundai | i20 | 2016 | 3.2 L/100km | 84 g/km | £1,149 |
| Nissan | Micra | 2018 | 3.2 L/100km | 85 g/km | £1,149 |
| Renault | Clio Sport Tourer | 2018 | 3.2 L/100km | 84 g/km | £1,149 |
| Vauxhall | Corsa 3-door | 2017 | 3.3 L/100km | 87 g/km | £1,185 |
| Renault | Clio | 2018 | 3.3 L/100km | 85 g/km | £1,185 |
Cheapest non-plug hybrids: Toyota dominates the efficiency list
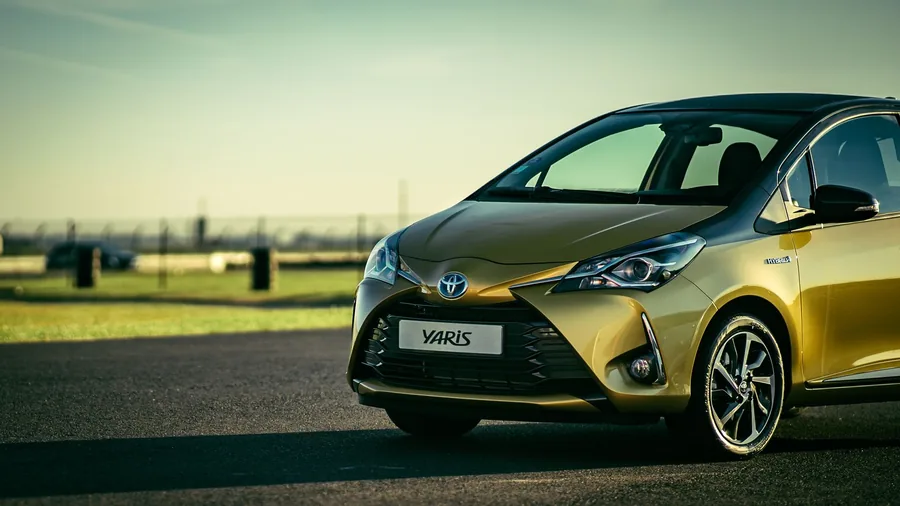
With the two mis-tagged Range Rover plug-in rows removed, the hybrid table shows seven models from 3.0 to 3.7 L/100km. The 2018 Toyota Prius heads the field at 3.0 L/100km and £950 per year, followed by the Yaris Hybrid at 3.3 L/100km (£1,045), Hyundai Ioniq at 3.4 L/100km (£1,077), Toyota Auris and Auris Touring Sports at 3.5 L/100km (£1,109), Lexus CT200h at 3.6 L/100km (£1,140) and Kia Niro at 3.7 L/100km (£1,172). Toyota appears four times in the top seven, reflecting a hybrid system calibrated for the test cycle and real-world urban driving alike. These figures are from self-charging hybrids — no plug, no claimed electric range — so the numbers are reproducible in daily use without needing a charger.
The Prius at 3.0 L/100km is the cheapest combustion car to run in the dataset, beating even the best diesel. The hybrid advantage comes from regenerative braking and engine-off coasting in urban cycles — the WLTP test includes significant stop-start sections where hybrids excel. On a steady motorway cruise the gap narrows because the battery cannot recharge from braking. The Yaris Hybrid at 3.3 L/100km is notable because it is a smaller, cheaper car than the Prius yet only 0.3 L/100km behind. For buyers who want hybrid efficiency without Prius styling or price, the Yaris and Auris are the practical alternatives.
| Make | Model | Year | Consumption | CO₂ | Annual fuel |
|---|---|---|---|---|---|
| Toyota | Prius | 2018 | 3.0 L/100km | 70 g/km | £950 |
| Toyota | Yaris Hybrid | 2018 | 3.3 L/100km | 75 g/km | £1,045 |
| Hyundai | Ioniq | 2017 | 3.4 L/100km | 79 g/km | £1,077 |
| Toyota | Auris | 2018 | 3.5 L/100km | 79 g/km | £1,109 |
| Toyota | Auris Touring Sports | 2018 | 3.5 L/100km | 81 g/km | £1,109 |
| Lexus | CT200h | 2018 | 3.6 L/100km | 82 g/km | £1,140 |
| Kia | Niro | 2018 | 3.7 L/100km | 86 g/km | £1,172 |
Why official plug-in hybrid figures are fantasy
Plug-in hybrids are tested with a full battery and the engine off for as much of the cycle as possible. The resulting combined figure — often 1–2 L/100km — assumes you recharge before every journey and never exceed the electric range. In practice most PHEV owners charge irregularly, drive longer trips on the engine alone, and carry the weight of a battery and motor that the engine must haul once depleted. The two Range Rover rows tagged as hybrids at 2.8 L/100km illustrate the problem: that figure is the official plug-in test result, not a number you will see on a motorway run. We exclude all PHEV rows from the hybrid leaderboard and averages because they do not represent a single consistent driving mode. If you can charge daily and rarely exceed 30–40 miles between charges, a PHEV can beat the non-plug hybrids; otherwise treat the official figure as a best-case laboratory bound.
The WLTP test for PHEVs uses a utility factor that weights electric and engine operation based on a theoretical daily driving pattern. For a PHEV with 50 km electric range, the test assumes roughly 70% of kilometres are driven on electricity. Real-world data from fleet operators shows the actual electric share is often below 30% for company cars and below 50% for private owners. Once the battery is flat, a PHEV becomes a heavy petrol car with a small engine — consumption often rises to 8–10 L/100km. This is why the two Range Rover rows at 2.8 L/100km are misleading: they represent a car driven almost entirely on grid electricity, not a hybrid operating in charge-sustaining mode.
Cheapest electric cars: why EV running cost is so low
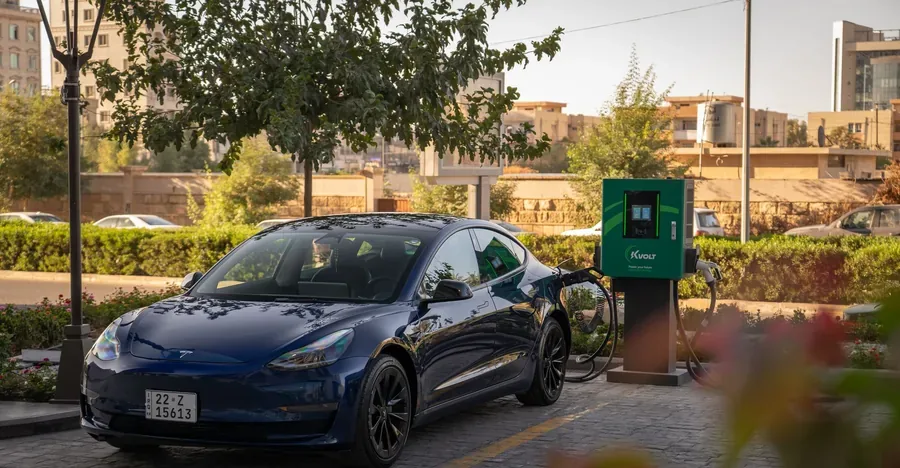
The electric table is led by the 2026 Mini Aceman at 10.9 kWh/100km and £554 per year — less than half the cheapest petrol Celerio. Twelve models sit between 10.9 and 14.7 kWh/100km, with annual costs from £554 to £747. The Mercedes-Benz CLA Saloon, Dacia Spring, Fiat 500, Tesla Model 3, Mini Cooper Electric, Peugeot 2008, Tesla Model Y, Volkswagen ID.7, Hyundai Kona Electric, Volkswagen ID.7 Tourer and Lexus RZ 350e complete the list. Electricity at £0.263/kWh is far cheaper per unit of energy than petrol at £1.64/L, and electric motors convert over 90% of that energy to motion versus roughly 30% for a petrol engine. The result is a structural cost advantage that no combustion car can match.
The EV table spans a much narrower range than the petrol table. This means EV choice can be driven by space, range and features rather than running cost. The Dacia Spring at £635 is the cheapest EV to buy and second cheapest to run, making it a compelling urban option. The Tesla Model 3 and Model Y appear because their heat-pump thermal systems and aerodynamic shapes keep consumption low despite their size.
| Make | Model | Year | Consumption | Annual fuel |
|---|---|---|---|---|
| Mini | Aceman | 2026 | 10.9 kWh/100km | £554 |
| Mercedes-Benz | CLA Saloon | 2026 | 12.2 kWh/100km | £620 |
| Dacia | Spring | 2026 | 12.5 kWh/100km | £635 |
| Fiat | 500 | 2025 | 13.3 kWh/100km | £676 |
| Tesla | Model 3 | 2026 | 13.8 kWh/100km | £701 |
| Mini | Cooper Electric | 2026 | 14.2 kWh/100km | £721 |
| Peugeot | 2008 | 2026 | 14.2 kWh/100km | £721 |
| Tesla | Model Y | 2026 | 14.2 kWh/100km | £721 |
| Volkswagen | ID.7 | 2026 | 14.2 kWh/100km | £721 |
| Hyundai | Kona Electric | 2023 | 14.3 kWh/100km | £726 |
| Volkswagen | ID.7 Tourer | 2026 | 14.6 kWh/100km | £742 |
| Lexus | RZ 350e | 2026 | 14.7 kWh/100km | £747 |
The thirsty end of the market: what the worst petrol cars cost
At the other extreme, seven high-performance and luxury models consume between 17.4 and 23.7 L/100km. The 2026 McLaren GT tops the list at 23.7 L/100km and £7,506 per year — 6.6 times the Celerio's fuel bill. Ferrari 812, Ferrari Monza, Rolls-Royce Phantom, Wraith, Ghost and Dawn fill the next six places, all above 17 L/100km and all costing between £5,511 and £6,398 annually. These cars are bought for performance and prestige, not economy, but the figures illustrate the maximum exposure a UK driver faces at current pump prices.
The McLaren GT at 23.7 L/100km costs roughly four times the petrol average and thirteen times the Mini Aceman per 100 km. The Rolls-Royce models cluster around 18 L/100km because they share a 6.75-litre V12 architecture. For context, the fuel cost of one McLaren GT equals the total fuel budget for six Suzuki Celerios. These figures are not anomalies — they are the certified WLTP values for cars that are on sale today.

| Make | Model | Year | Consumption | CO₂ | Annual fuel |
|---|---|---|---|---|---|
| McLaren | GT | 2026 | 23.7 L/100km | 270 g/km | £7,506 |
| Ferrari | 812 | 2022 | 20.2 L/100km | 373 g/km | £6,398 |
| Ferrari | Monza | 2022 | 18.8 L/100km | 366 g/km | £5,954 |
| Rolls-Royce | Phantom | 2026 | 18.7 L/100km | 351 g/km | £5,923 |
| Rolls-Royce | Wraith | 2026 | 18.0 L/100km | 357 g/km | £5,701 |
| Rolls-Royce | Ghost | 2026 | 17.9 L/100km | 359 g/km | £5,669 |
| Rolls-Royce | Dawn | 2026 | 17.4 L/100km | 370 g/km | £5,511 |
Averages by fuel type across the UK dataset
Across the full 4,549-record dataset the average consumption and annual fuel cost for each fuel type are: petrol 7.75 L/100km (£2,454/yr, n=2,204), diesel 5.13 L/100km (£1,844/yr, n=1,528), hybrid 6.16 L/100km (£1,952/yr, n=326), and electric 17.4 kWh/100km (£883/yr, n=174). Plug-in hybrids account for 317 records but are excluded from the hybrid average for the reason explained above. The petrol average is pulled up by SUVs, performance cars and older automatics; the diesel average reflects a mix of efficient superminis and larger SUVs; the hybrid average is lifted by larger hybrid SUVs that cannot match the city-car efficiency of the Prius or Yaris.
The average petrol car costs more than double the best petrol per 100 km. The diesel average is 27% cheaper than the petrol average, but the best diesel is only 15% cheaper than the best petrol. The hybrid average sits between petrol and diesel because the dataset includes many hybrid SUVs that prioritise power over efficiency. The EV average is 4.5 times cheaper than the petrol average per kilometre.
The spread between cheapest and thirstiest petrol: £6,366 a year
The gap between the cheapest petrol (Suzuki Celerio £1,140) and the thirstiest petrol (McLaren GT £7,506) is £6,366 per year at 12,000 miles. That is not a theoretical range — it is the difference between two real cars you can buy today. For a household running two cars, choosing the efficient model for the high-mileage commuter and the thirsty model for the weekend enthusiast creates a large annual swing in the fuel budget alone. The spread is wider than the total annual fuel cost of the cheapest electric car (£554).
What the consumption figures do not include
The tables show only the energy cost of moving the vehicle — fuel or electricity purchased at the stated prices. They do not include insurance, which varies by driver, postcode and car group; servicing and repair costs, which depend on age, mileage and dealer labour rates; depreciation, which is roughly 15–25% in year one and about 50% over five years for a typical new car; VED beyond the £190 reference band; MOT fees beyond the £54.85 cap; or public charging prices for EVs, which are typically higher than the household rate. If you need a total cost of ownership, use the car cost calculator with your own insurance quote, mileage and ownership period.
How to use these numbers to choose a car
Start with your annual mileage. At 12,000 miles the fuel gaps shown are accurate; at 6,000 miles halve them, at 24,000 miles double them. Next, match the powertrain to your driving pattern: city and short trips favour non-plug hybrids and small petrol cars; motorway cruising favours diesels and efficient EVs with large batteries; mixed use with home charging favours the cheapest electric models. Then check the VED band for the specific model year — the £190 figure is a reference only, and some of the cleanest cars here sit in lower bands. Finally, get insurance quotes for your shortlist before deciding; an insurance difference can outweigh a fuel saving.
- City and short trips → non-plug hybrid or small petrol
- Motorway miles → efficient diesel or long-range EV
- Home charging available → cheapest electric models
- No home charging → hybrid or efficient petrol
The limits of official test figures
WLTP and NEDC are laboratory cycles conducted at 23°C on a rolling road with no wind, no passengers, no roof load and no air conditioning. Real-world consumption is typically 10–25% higher for petrol and diesel, 15–30% higher for EVs in winter, and wildly higher for plug-in hybrids driven beyond their electric range. The figures here are the only consistent, legally mandated basis for comparing models, but they are not a promise of what you will spend. Treat them as a ranked index: if Car A tests at 4.0 L/100km and Car B at 6.0 L/100km, Car A will almost always cost less to run in the same hands.
Who this data suits and who it does not
This ranking is built for private buyers and fleet managers who want a fuel-cost baseline before layering on insurance, finance, maintenance and depreciation. It is less useful for company-car tax calculations (which use a different CO₂ methodology), for drivers who rely on public rapid charging (where electricity costs more than the household rate), for buyers comparing used cars with unknown service history, or for anyone whose annual mileage is far from 12,000 — the cost ratios stay similar but the absolute numbers scale linearly with distance. For those cases, plug your own mileage and energy prices into the calculators linked below.
Key comparisons at a glance
The data supports four headline comparisons that hold across the dataset. Cheapest petrol (Suzuki Celerio £1,140) versus the UK petrol average (£2,454) saves £1,314 a year. Cheapest electric (Mini Aceman £554) versus cheapest petrol (£1,140) saves £586. Cheapest diesel (Peugeot 208 £1,078) versus cheapest petrol (£1,140) saves £62. Average electric (£883) versus average petrol (£2,454) saves £1,571. These gaps are driven by energy price and efficiency, not by tax or incentives, so they persist as long as the pump and socket prices maintain their current ratio.
Fuel mix in the analysed dataset
The 4,549 records break down as 2,204 petrol, 1,528 diesel, 326 hybrid, 317 plug-in hybrid and 174 electric. Petrol dominates the database because it covers every segment from city cars to supercars; diesel is concentrated in superminis, family hatchbacks and SUVs; hybrids are mostly Toyota and Lexus models from 2015 onward; plug-in hybrids appear across premium and mainstream brands but are excluded from the hybrid average; electric models are the smallest group but growing fastest, with 2026 adding the Mini Aceman, Mercedes-Benz CLA Saloon, Peugeot 2008, Tesla Model 3, Tesla Model Y, Volkswagen ID.7 and ID.7 Tourer, Mini Cooper Electric and Lexus RZ 350e to the ranked list.
Why the Mini Aceman leads the electric table
The 2026 Mini Aceman achieves 10.9 kWh/100km through a combination of a small frontal area, low drag coefficient, a single-motor front-drive layout and a battery sized for efficiency rather than maximum range. At £554 per year it undercuts the next EV (Mercedes-Benz CLA Saloon at £620). The gap to the least efficient EV in the table (Lexus RZ 350e at £747) is still far smaller than the £6,366 spread in petrol. This compression means that even a relatively inefficient EV is cheaper to run than the most efficient petrol car, removing the need to chase the absolute lowest consumption figure when choosing an electric model.
Depreciation context for the cheapest-to-run models
Depreciation is the largest single cost for most owners but it is not captured in the fuel tables. As a rough guide, a typical new car loses 15–25% of its value in year one and about 50% over five years. Small city cars like the Celerio, i10, Aygo and Citigo tend to depreciate faster in percentage terms because they start from a low price, but the absolute cash loss is smaller. Hybrids and efficient diesels often hold value better thanks to strong used demand from Uber and private-hire buyers. EVs depreciate variably — Tesla models have historically held value well, while some early mainstream EVs lost value quickly as battery technology improved. Always model depreciation for your specific shortlist using the depreciation calculator.
Use the free calculators
Frequently asked questions
What is the single cheapest car to run in the UK for 2026?
The 2026 Mini Aceman electric at 10.9 kWh/100km costs £554 per year in electricity at £0.263/kWh — less than half the £1,140 of the cheapest petrol (Suzuki Celerio). Among non-EVs, the 2018 Toyota Prius hybrid at £950 is the lowest.
How much does the average UK petrol car cost in fuel per year?
The UK petrol average across 2,204 records is 7.75 L/100km, which equals £2,454 per year at £1.64/L and 12,000 miles. The cheapest petrol (Suzuki Celerio) saves £1,314 against that average.
Are plug-in hybrids cheaper to run than normal hybrids?
Only if you charge daily and rarely exceed the electric range. Official PHEV figures (often 1–2 L/100km) assume a full battery every trip; real-world fuel use jumps once the battery is depleted. We exclude PHEVs from the hybrid leaderboard because the test figure does not represent a single consistent driving mode.
Why is the diesel advantage so small in 2026?
Pump diesel costs £1.86/L versus £1.64/L for petrol (13% more), modern petrol turbos have closed the efficiency gap, and VED no longer favours diesel. The cheapest diesel (Peugeot 208 £1,078) saves only £62 a year over the cheapest petrol (Celerio £1,140) at 12,000 miles.
Do these fuel costs include insurance, servicing or depreciation?
No. The tables show only energy cost — fuel or electricity at the stated prices. Insurance, servicing, repairs, depreciation (roughly 15–25% year one, ~50% over five years), VED, MOT and public charging prices are excluded. Use the car cost calculator to add those.
How reliable are the official consumption figures for real-world driving?
WLTP and NEDC are lab tests at 23°C with no load, no AC and no wind. Real-world use is typically 10–25% higher for petrol and diesel, 15–30% higher for EVs in winter, and much higher for PHEVs driven beyond electric range. Treat the figures as a ranked index: a car tested at 4.0 L/100km will almost always cost less than one tested at 6.0 L/100km.
Which calculator should I use to get my own total running cost?
Start with the car running cost calculator for a full ownership model, the fuel cost calculator for pure fuel spend, or the EV charging calculator if you are comparing home versus public charging rates. All three let you enter your mileage, energy prices and ownership period.